System configured for measuring physiological parameters
Islam Ja
U.S. patent number 10,188,299 [Application Number 15/594,053] was granted by the patent office on 2019-01-29 for system configured for measuring physiological parameters. This patent grant is currently assigned to Omni Medsci, Inc.. The grantee listed for this patent is OMNI MEDSCI, INC.. Invention is credited to Mohammed N. Islam.


View All Diagrams
| United States Patent | 10,188,299 |
| Islam | January 29, 2019 |
| **Please see images for: ( Certificate of Correction ) ** |
System configured for measuring physiological parameters
Abstract
A wearable device for measuring physiological parameters includes a light source having a plurality of semiconductor light emitting diodes (LEDs) each configured to generate an output optical beam, wherein at least a portion of the one or more optical beam wavelengths is a near-infrared wavelength. The light source is configured to increase signal-to-noise ratio by increasing light intensity for at least one of the LEDs and by increasing a pulse rate of at least one of the LEDs. A lens is configured to receive the output optical beam and to deliver a lens output beam to tissue. A detection system generates an output signal in response to the lens output beam reflected from the tissue, wherein the detection system is configured to be synchronized to the light source, and is located a different distance from a first one of the LEDs than a second one of the LEDs.
| Inventors: | Islam; Mohammed N. (Ann Arbor, MI) | ||||||||||
|---|---|---|---|---|---|---|---|---|---|---|---|
| Applicant: |
|
||||||||||
| Assignee: | Omni Medsci, Inc. (Ann Arbor,
MI) |
||||||||||
| Family ID: | 51016052 | ||||||||||
| Appl. No.: | 15/594,053 | ||||||||||
| Filed: | May 12, 2017 |
Prior Publication Data
| Document Identifier | Publication Date | |
|---|---|---|
| US 20170248567 A1 | Aug 31, 2017 | |
Related U.S. Patent Documents
| Application Number | Filing Date | Patent Number | Issue Date | ||
|---|---|---|---|---|---|
| 14875709 | Oct 6, 2015 | 9651533 | |||
| 14108986 | Oct 20, 2015 | 9164032 | |||
| 61747487 | Dec 31, 2012 | ||||
| Current U.S. Class: | 1/1 |
| Current CPC Class: | A61B 5/0075 (20130101); G01J 3/108 (20130101); G01N 33/15 (20130101); A61B 5/14546 (20130101); G01N 33/49 (20130101); A61B 5/742 (20130101); G01N 33/02 (20130101); G01N 21/39 (20130101); G01J 3/14 (20130101); A61B 5/14532 (20130101); A61B 5/7257 (20130101); G01N 21/3563 (20130101); G01N 33/025 (20130101); A61B 5/1455 (20130101); G01N 33/442 (20130101); G01J 3/453 (20130101); G01N 21/359 (20130101); G16H 40/67 (20180101); A61B 5/4547 (20130101); G01N 21/35 (20130101); A61B 5/0013 (20130101); A61B 5/6801 (20130101); G01N 21/88 (20130101); A61B 5/0022 (20130101); G01J 3/0218 (20130101); A61B 5/0088 (20130101); G01J 3/42 (20130101); G06F 19/00 (20130101); A61B 5/7405 (20130101); G01J 3/28 (20130101); G01J 3/2823 (20130101); A61B 5/0086 (20130101); G01N 2021/3595 (20130101); A61B 2562/0233 (20130101); H01S 3/302 (20130101); G01M 3/38 (20130101); H01S 3/0092 (20130101); G01N 2201/0221 (20130101); G01N 21/85 (20130101); G01N 2201/129 (20130101); H01S 3/06758 (20130101); G01N 2201/08 (20130101); G01J 3/1838 (20130101); G01N 2201/061 (20130101); A61B 2576/02 (20130101); A61B 2562/0238 (20130101); G01J 2003/1208 (20130101); G01N 2021/399 (20130101); G01N 21/9508 (20130101); G01J 2003/104 (20130101); G01N 2201/06113 (20130101); G01J 2003/2826 (20130101); Y02A 90/10 (20180101); G01N 2201/12 (20130101); A61B 2562/146 (20130101); G01N 2201/062 (20130101) |
| Current International Class: | G01J 3/00 (20060101); A61B 5/00 (20060101); A61B 5/1455 (20060101); G01J 3/10 (20060101); G01J 3/28 (20060101); G01J 3/453 (20060101); G01N 21/359 (20140101); G01J 3/14 (20060101); A61B 5/145 (20060101); G01N 33/15 (20060101); G01N 33/49 (20060101); G01N 21/3563 (20140101); G01N 21/39 (20060101); G01N 33/02 (20060101); G01N 33/44 (20060101); G01N 21/88 (20060101); G01J 3/42 (20060101); G01J 3/02 (20060101); H01S 3/30 (20060101); G01J 3/18 (20060101); G01M 3/38 (20060101); G01J 3/12 (20060101); G01N 21/35 (20140101); G01N 21/85 (20060101); H01S 3/00 (20060101); G01N 21/95 (20060101); H01S 3/067 (20060101) |
| Field of Search: | ;356/300 |
References Cited [Referenced By]
U.S. Patent Documents
| 4063106 | December 1977 | Ashkin et al. |
| 4158750 | June 1979 | Sakoe et al. |
| 4221997 | September 1980 | Flemming |
| 4275266 | June 1981 | Lasar |
| 4374618 | February 1983 | Howard |
| 4403605 | September 1983 | Tanikawa |
| 4462080 | July 1984 | Johnstone et al. |
| 4516207 | May 1985 | Moriyama et al. |
| 4523884 | June 1985 | Clement et al. |
| 4605080 | August 1986 | Lemelson |
| 4641292 | February 1987 | Tunnell et al. |
| 4704696 | November 1987 | Reimer et al. |
| 4728974 | March 1988 | Nio et al. |
| 4762455 | August 1988 | Coughlan et al. |
| 4776016 | October 1988 | Hansen |
| 4958910 | September 1990 | Taylor et al. |
| 4989253 | January 1991 | Liang et al. |
| 5078140 | January 1992 | Kwoh |
| 5084880 | January 1992 | Esterowitz et al. |
| 5086401 | February 1992 | Glassman et al. |
| 5134620 | July 1992 | Huber |
| 5142930 | September 1992 | Allen et al. |
| 5180378 | January 1993 | Kung et al. |
| 5191628 | March 1993 | Byron |
| 5218655 | June 1993 | Mizrahi |
| 5230023 | July 1993 | Nakano |
| 5246004 | September 1993 | Clarke et al. |
| 5267152 | November 1993 | Yang et al. |
| 5267256 | November 1993 | Saruwatari et al. |
| 5267323 | November 1993 | Kimura |
| 5300097 | April 1994 | Lerner et al. |
| 5303148 | April 1994 | Mattson et al. |
| 5305427 | April 1994 | Nagata |
| 5313306 | May 1994 | Kuban et al. |
| 5323404 | June 1994 | Grubb |
| 5345538 | September 1994 | Narayannan et al. |
| 5368224 | November 1994 | Richardson et al. |
| 5400165 | March 1995 | Gnauck et al. |
| 5408409 | April 1995 | Glassman et al. |
| 5458122 | October 1995 | Hethuin |
| 5544654 | August 1996 | Murphy et al. |
| 5572999 | November 1996 | Funda et al. |
| 5617871 | April 1997 | Burrows |
| 5631758 | May 1997 | Knox et al. |
| 5687734 | November 1997 | Dempsey et al. |
| 5695493 | December 1997 | Nakajima et al. |
| 5696778 | December 1997 | MacPherson |
| 5704351 | January 1998 | Mortara et al. |
| 5718234 | February 1998 | Warden et al. |
| 5746206 | May 1998 | Mannheimer |
| 5747806 | May 1998 | Khalil |
| 5748103 | May 1998 | Flach et al. |
| 5792204 | August 1998 | Snell |
| 5795300 | August 1998 | Bryars |
| 5812978 | September 1998 | Nolan |
| 5855550 | January 1999 | Lai et al. |
| 5862803 | January 1999 | Besson et al. |
| 5867305 | February 1999 | Waarts et al. |
| 5912749 | June 1999 | Harstead et al. |
| 5919134 | July 1999 | Diab |
| 5944659 | August 1999 | Flach et al. |
| 5950629 | September 1999 | Taylor et al. |
| 5957854 | September 1999 | Besson et al. |
| 5970457 | October 1999 | Brant et al. |
| 6014249 | January 2000 | Fermann et al. |
| 6031603 | February 2000 | Fine et al. |
| 6043927 | March 2000 | Islam |
| 6115673 | September 2000 | Malin |
| 6181414 | January 2001 | Raz et al. |
| 6185535 | February 2001 | Hedin et al. |
| 6200309 | March 2001 | Rice et al. |
| 6212310 | April 2001 | Waarts et al. |
| 6224542 | May 2001 | Chang et al. |
| 6246707 | June 2001 | Yin et al. |
| 6246896 | June 2001 | Dumoulin |
| 6273858 | August 2001 | Fox et al. |
| 6278975 | August 2001 | Brant et al. |
| 6281471 | August 2001 | Smart |
| 6285897 | September 2001 | Kilcoyne |
| 6289238 | September 2001 | Besson et al. |
| 6301271 | October 2001 | Sanders et al. |
| 6301273 | October 2001 | Sanders et al. |
| 6325978 | December 2001 | Labuda et al. |
| 6333803 | December 2001 | Kurotori et al. |
| 6337462 | January 2002 | Smart |
| 6340806 | January 2002 | Smart et al. |
| 6350261 | February 2002 | Domankevitz et al. |
| 6364834 | April 2002 | Reuss et al. |
| 6374006 | April 2002 | Islam et al. |
| 6381391 | April 2002 | Islam et al. |
| 6402691 | June 2002 | Peddicord et al. |
| 6407853 | June 2002 | Samson et al. |
| 6436107 | August 2002 | Wang et al. |
| 6441747 | August 2002 | Khair et al. |
| 6442430 | August 2002 | Ferek-Petric |
| 6443890 | September 2002 | Schulze et al. |
| 6450172 | September 2002 | Hartlaub et al. |
| 6453201 | September 2002 | Daum et al. |
| 6454705 | September 2002 | Cosentino et al. |
| 6458120 | October 2002 | Shen et al. |
| 6462500 | October 2002 | L'Hegarat et al. |
| 6463361 | October 2002 | Wang et al. |
| 6480656 | November 2002 | Islam et al. |
| 6512936 | January 2003 | Monfre |
| 6534012 | April 2003 | Viswanathan |
| 6549702 | April 2003 | Islam et al. |
| 6567431 | May 2003 | Tabirian et al. |
| 6587702 | July 2003 | Ruchti |
| 6603910 | August 2003 | Islam et al. |
| 6605080 | August 2003 | Altshuler et al. |
| 6611643 | August 2003 | Birk |
| 6619835 | September 2003 | Kita |
| 6625180 | September 2003 | Bufetov et al. |
| 6631025 | October 2003 | Islam et al. |
| 6640117 | October 2003 | Makarewicz |
| 6659947 | December 2003 | Carter et al. |
| 6659999 | December 2003 | Anderson et al. |
| 6701170 | March 2004 | Stetson |
| 6708048 | March 2004 | Chance |
| 6731967 | May 2004 | Turcott |
| 6738652 | May 2004 | Mattu |
| 6760148 | July 2004 | Islam |
| 6773922 | August 2004 | Jeng |
| 6788965 | September 2004 | Ruchti |
| 6802811 | October 2004 | Slepian |
| 6816241 | November 2004 | Grubisic |
| 6847336 | January 2005 | Lemelson |
| 6864978 | March 2005 | Hazen |
| 6885498 | April 2005 | Islam |
| 6885683 | April 2005 | Fermann et al. |
| 6916096 | July 2005 | Eberl et al. |
| 6943936 | September 2005 | Islam et al. |
| 6990364 | January 2006 | Ruchti |
| 7010336 | March 2006 | Lorenz |
| 7027467 | April 2006 | Baev et al. |
| 7060061 | June 2006 | Altshuler et al. |
| 7105823 | September 2006 | Abrahamsson et al. |
| 7133710 | November 2006 | Acosta |
| 7167300 | January 2007 | Fermann et al. |
| 7184148 | February 2007 | Alphonse |
| 7209657 | April 2007 | Islam |
| 7233816 | June 2007 | Blank |
| 7259906 | August 2007 | Islam |
| 7263288 | August 2007 | Islam |
| 7294105 | November 2007 | Islam |
| 7299080 | November 2007 | Acosta |
| 7317938 | January 2008 | Lorenz |
| 7332784 | February 2008 | Mills et al. |
| 7356364 | April 2008 | Bullock et al. |
| 7395158 | July 2008 | Monfre |
| 7433116 | October 2008 | Islam |
| 7468036 | December 2008 | Rulkov et al. |
| 7519253 | April 2009 | Islam |
| 7519406 | April 2009 | Blank |
| 7620674 | November 2009 | Ruchti |
| 7648463 | January 2010 | Elhag et al. |
| 7697966 | April 2010 | Monfre |
| 7771320 | August 2010 | Riley et al. |
| 7787503 | August 2010 | Wadsworth |
| 7787924 | August 2010 | Acosta |
| 7800818 | September 2010 | Mattsson |
| 7807718 | October 2010 | Hashim |
| 7848605 | December 2010 | Ridder et al. |
| 7890158 | February 2011 | Rowe et al. |
| 8000574 | August 2011 | Buchter |
| 8145286 | March 2012 | Arai |
| 8157730 | April 2012 | LeBoeuf et al. |
| 8158493 | April 2012 | Shah et al. |
| 8172761 | May 2012 | Rulkov et al. |
| 8180422 | May 2012 | Rebec |
| 8180591 | May 2012 | Yuen et al. |
| 8213007 | July 2012 | Wang et al. |
| 8310336 | November 2012 | Muhsin et al. |
| 8315682 | November 2012 | Such et al. |
| 8430310 | April 2013 | Ho et al. |
| 8463576 | June 2013 | Yuen et al. |
| 8472108 | June 2013 | Islam |
| 8475367 | July 2013 | Yuen et al. |
| 8509882 | August 2013 | Albert et al. |
| RE44875 | April 2014 | Kiani et al. |
| 8755871 | June 2014 | Weng et al. |
| 8788002 | July 2014 | LeBoeuf et al. |
| 8945017 | February 2015 | Venkatraman et al. |
| 8948832 | February 2015 | Hong et al. |
| 8954135 | February 2015 | Yuen et al. |
| 9142117 | September 2015 | Muhsin et al. |
| 9179876 | November 2015 | Ochs et al. |
| 9192329 | November 2015 | Al-Ali |
| 9241676 | January 2016 | Lisogurski et al. |
| 9326712 | May 2016 | Kiani |
| 9596990 | March 2017 | Park et al. |
| 9651533 | May 2017 | Islam |
| 9675250 | June 2017 | Tverskoy |
| 9757040 | September 2017 | Islam |
| 9820658 | November 2017 | Tran |
| 9861286 | January 2018 | Islam |
| 9885698 | February 2018 | Islam |
| 2002/0013518 | January 2002 | West et al. |
| 2002/0019584 | February 2002 | Schulze et al. |
| 2002/0032468 | March 2002 | Hill et al. |
| 2002/0082612 | June 2002 | Moll et al. |
| 2002/0109621 | August 2002 | Khair et al. |
| 2002/0115914 | August 2002 | Russ |
| 2002/0128846 | September 2002 | Miller |
| 2002/0178003 | November 2002 | Gehrke et al. |
| 2003/0022126 | January 2003 | Buchalla |
| 2004/0174914 | September 2004 | Fukatsu |
| 2004/0240037 | December 2004 | Harter |
| 2005/0049468 | March 2005 | Carlson et al. |
| 2005/0111500 | May 2005 | Harter et al. |
| 2005/0133691 | June 2005 | Doppke et al. |
| 2005/0209516 | September 2005 | Fraden |
| 2006/0198397 | September 2006 | Korolev et al. |
| 2006/0223032 | October 2006 | Fried |
| 2006/0245461 | November 2006 | Islam |
| 2006/0268393 | November 2006 | Islam |
| 2006/0281982 | December 2006 | Grata et al. |
| 2006/0283931 | December 2006 | Polli et al. |
| 2007/0021670 | January 2007 | Mandelis et al. |
| 2007/0078348 | April 2007 | Holman |
| 2008/0086318 | April 2008 | Gilley et al. |
| 2008/0105665 | May 2008 | Kondo |
| 2009/0028193 | January 2009 | Islam |
| 2009/0105605 | April 2009 | Abreu |
| 2009/0204110 | August 2009 | Islam |
| 2009/0244288 | October 2009 | Fujimoto et al. |
| 2009/0287067 | November 2009 | Dorogusker et al. |
| 2010/0046067 | February 2010 | Fermann et al. |
| 2010/0160794 | June 2010 | Banet et al. |
| 2010/0217102 | August 2010 | LeBoeuf et al. |
| 2010/0322490 | December 2010 | Pan |
| 2010/0331637 | December 2010 | Ting |
| 2011/0040197 | February 2011 | Welch et al. |
| 2011/0143364 | June 2011 | Kim |
| 2011/0208015 | August 2011 | Welch et al. |
| 2011/0237911 | September 2011 | Lamego et al. |
| 2011/0267688 | November 2011 | Kleppe et al. |
| 2011/0282167 | November 2011 | Ridder et al. |
| 2011/0292376 | December 2011 | Kukushkin et al. |
| 2012/0013722 | January 2012 | Wong |
| 2012/0203077 | August 2012 | He et al. |
| 2012/0239013 | September 2012 | Islam |
| 2012/0245439 | September 2012 | Andre et al. |
| 2012/0310062 | December 2012 | Li et al. |
| 2012/0316455 | December 2012 | Rahman et al. |
| 2013/0274569 | October 2013 | Islam |
| 2013/0281795 | October 2013 | Varadan |
| 2013/0303921 | November 2013 | Chu et al. |
| 2013/0327966 | December 2013 | Fidler et al. |
| 2014/0078510 | March 2014 | Rubio Guivernau et al. |
| 2014/0081100 | March 2014 | Muhsin et al. |
| 2014/0236021 | August 2014 | Islam |
| 2014/0249427 | September 2014 | Liu |
| 2014/0275852 | September 2014 | Hong et al. |
| 2014/0275854 | September 2014 | Venkatraman et al. |
| 2015/0011851 | January 2015 | Mehta et al. |
| 2016/0045118 | February 2016 | Kiani |
| 102010012987 | Oct 2010 | DE | |||
| 1148666 | Oct 2001 | EP | |||
| 2005270544 | Oct 2005 | JP | |||
| WO09715240 | May 1997 | WO | |||
| WO97049340 | Dec 1997 | WO | |||
| WO01150959 | Jul 2001 | WO | |||
| 200189362 | Nov 2001 | WO | |||
| 200227640 | Apr 2002 | WO | |||
| 200228123 | Apr 2002 | WO | |||
| 2005013843 | Feb 2005 | WO | |||
| 2007061772 | May 2007 | WO | |||
| 2009130464 | Oct 2009 | WO | |||
| WO2013012938 | Jan 2013 | WO | |||
| WO2015084376 | Jun 2015 | WO | |||
Other References
|
US. Appl. No. 61/350,673; titled: Opticoustic Sensor; Inventor: Massi Joe E. Kiani; filed Jun. 2, 2010. cited by applicant . International Search Report and Written Opinion for International Application No. PCT/US2013/075700 dated Apr. 24, 2014. cited by applicant . International Preliminary Report on Patentability for International Application No. PCT/US2013/075700 dated Jul. 9, 2015. cited by applicant . Ooi ET, Zhang XQ, Chen JH, Soh PH, Ng K, Yeo JH, "Non-invasive glucose measurement using multiple laser diodes," Optical Diagnostic and Sensing VII, edited by Gerard L. Cote, Alexander V. Priezzhev, Proc. of SPIE vol. 6445, 64450K , (2007). cited by applicant . Schulz, I., J. Putzger, A. Niklas, M. Brandt, A. Jager, A. Hardt, S. Knorzer, K.A. Hiller, S. Loffler, G. Schmalz, S.N. Danilov, S. Giglberger, M. Hirmer, S.D. Ganichev, G. Monkman, "PPG signal acquisition and analysis on in vitro tooth model for dental pulp vitality assessment," ARC Submission 16, (2012). cited by applicant . Drexler, C., Hirmer, M., Danilov, S., Giglberger, S., Putzger, J., Niklas, A., Jager, A., Hiller, K., Loffler, S., Schmalz, G., Redlich, B., Schulz, I., Monkman, G., Ganichev, S. "Infrared spectroscopy for clinical diagnosis of dental pulp vitality." Infrared, Millimeter, and Terahertz Waves (IRMMW-THz), 2012 37th International Conference on. IEEE (2012). cited by applicant . Hirmer, Marion, Danilov, Sergey, Giglberger, Stephan, Putzger, Jurgen, Niklas, Andreas, Jager, Andreas, Hiller, Karl-Anton, Loffler, Susanne, Schmalz, Gottfried, Redlich, Britta, Schulz, Irene, Monkman, Gareth, Ganichev, Sergey. "Spectroscopic Study of Human Teeth and Blood from Visible to Terahertz Frequencies for Clinical Diagnosis of Dental Pulp Vitality." Journal of Infrared, Millimeter, and Terahertz Waves 33.3 (2012): 366-375. cited by applicant . Na, J, J.H. Baek, S.Y. Ryu, C. Lee, B.H. Lee, "Tomographic imaging of incipient dental-caries using optical coherence tomography and comparison with various modalities," Optical Review, vol. 16, No. 4, pp. 426-431 (2009). cited by applicant . Extended European Search Report for European Application No. 17155541.0 dated May 24, 2017. cited by applicant . Pan, Yingtian, et al., "Hand-held arthroscopic optical coherence tomography for in vivo high-resolution imaging of articular cartilage", Journal of Biomedical Optics 8(4), Oct. 2003, pp. 648-654. cited by applicant . Xie, Tuqiang, et al., "Endoscopic optical coherence tomography with a modified microelectromechanical systems mirror for detection of bladder cancers", Applied Optics, vol. 42, No. 31, Nov. 1, 2003, pp. 6422-6426. cited by applicant . Dubois, A., et al., "Three-dimensional cellular-level imaging using full-field optical coherence tomography", Physics in Medicine and Biology, Phys. Med. Biol. 49, 2004, pp. 1227-1234. cited by applicant . Park, Jesung, et al., "Analysis of birefringent image in the retinal nerve fiber layer by polarization sensitive optical coherence tomography", Ophthalmic Technologies XIV, Proceedings of SPIE, vol. 5314, 2004, pp. 188-194. cited by applicant . Unterhuber, A., et al., "Advances in broad bandwidth light sources for ultrahigh resolution optical coherence tomography", Physics in Medicine and Biology, Phys. Med. Biol. 49, 2004, pp. 1235-1246. cited by applicant . Drexler, Wolfgang, "Ultrahigh-resolution optical coherence tomography", Journal of Biomedical Optics, vol. 9, No. 1, Jan./Feb. 2004, pp. 47-74. cited by applicant . Schmitt, Joseph, et al., "Intravascular Optical Coherence Tomography Opens a Window Onto Coronary Artery Disease", Optics & Photonics News, Feb. 2004, pp. 20-25. cited by applicant . Nassif, N.A., et al., "In vivo high-resolution video-rate spectral-domain optical coherence tomography of the human retina and optic nerve", Optics Express, vol. 12, No. 3, Feb. 9, 2004, pp. 367-376. cited by applicant . Choi, Seung-Ho, et al., "Observation of Optical Precursors in Water", Physical Review Letters, vol. 92, No. 19, May 14, 2004, pp. 193903-1-193903-.3. cited by applicant . Pierce, Mark C., et al., "Advances in Optical Coherence Tomography imaging for Dermatology", Optical Coherence Tomography Advances, The Journal of Investigative Dermatology, Sep. 3, 2004, pp. 458-463. cited by applicant . "State-Specific Trends in Chronic Kidney Failure--United States, 1990-2001", Morbidity and Mortality Weekly Report, Department of Health and Human Services Centers for Disease Control and Prevention, vol. 53, No. 39, copied from internet: file://C:\Documents and Settings\eturlo\Desktop\State-Specific Trends in Chronic Kidney . . . Feb. 12, 2010, Oct. 8, 2004, pp. 918-920. cited by applicant . I.B. Ads, A.A.E. Wagie, N.B. Mariun, A.B.E. Jammal, "An Internet-based blood pressure monitoring system for patients," Journal of Telemedicine and Telecare, 2001, pp. 51-53. cited by applicant . R.H. Istepanian, B. Woodward, P.A. Bales, S. Chen, B. Luk, "The comparative performance of mobile telemediCal systems based on the IS-54 and GSM cellular telephone standards," Journal of Telemedicine and Telecare, 1999, pp. 97-104. cited by applicant . Shaw, et al, IR Supercontinuum Generation in As--Se Photonic Crystal Fiber, Optical Society of America, Copyright 2005, 3 pages. cited by applicant . PCT/US06/44451, Notification of Transmittal of the International Search Report and the Written Opinion of the International Searching Authority, or the Declaration, Nov. 29, 2007, 12 pages. cited by applicant . G.S. Edwards et al., "Free-electron-laser-based biophysical and biomedical instrumentation," American Institute of Physics, vol. 74, No. 7, Jul. 2003, pp. 3207-3245. cited by applicant . Computer Motion, Inc., "501(k) Summary--ZEUS.RTM. MicroWrist.TM. Surgical System and Accessories," Sep. 24, 2002, 6 pages. cited by applicant . Computer Motion, Inc. "HERMES.TM. O.R. Control Center--510(k) Summary of Safety and Effectiveness," Oct. 11, 2002, 5 pages. cited by applicant . K.M. Joos, et al. "Optic Nerve Sheath Fenestration with a Novel Wavelength Produced by the Free Electron Laser (FEL)," Lasers in Surgery and Medicine, 27: 2000,191-205. cited by applicant . J. Sanghera, I. Aggarwal, "IR Fiber Optics at NRL," undated, 10 pages. cited by applicant . J. Sanghera, L.B. Shaw, I.D. Aggarwal, "Applications of chalcogenide glass optical fibers," Academic of Science, 2003, pp. 1-11. cited by applicant . B. Rigas, P.T.T. Wong, "Human Colon Adenocarcinoma Cell Lines Display Infrared Spectroscopic Features," Cancer Research, Jan. 1, 1992, pp. 84-88. cited by applicant . G. Edwards, et al., "Comparison of OPA and Mark-III FEL for Tissue Ablation at 6.45 Microns," Department of Physics and Free Electron Laser Laboratory, Duke University, 2002, 7 pages. cited by applicant . Glenn Edwards, "Biomedical and potential clinical applications for pulsed lasers operating near 6.45 um," Society of Photo-Optical Instrumentation Engineers, 1995, 2 pages. cited by applicant . Passat, "Solid-State Lasers and Optical Components," Jul. 14, 2003, 5 pages. cited by applicant . P.A. Thielen and L.B. Shaw, et al., "Small-core As--Se fiber for Raman amplification," Optics LETI-ERS, vol. 28, No. 16, Aug. 15, 2003, 3 pages. cited by applicant . R.Rox Anderson, et al., "Selective Photothermolysis: Precise Microsurgery by Selective Absorption of Pulsed Radiation," Department of Dermatology, Harvard Medical School, Science, vol. 220, Apr. 29, 1983, 4 pages. cited by applicant . U.S. Appl. No. 10/652,276, "System and Method for Voice Control of Medical devices," by Mohammed N. Islam, abandoned filed Aug. 29, 2003. cited by applicant . U.S. Appl. No. 10/757,341, "System and Method for Voice Control of Medical devices," by Mohammed N. Islam, issued filed Jan. 13, 2004. cited by applicant . U.S. Appl. No. 12/206,432, "System and Method for Voice Control of Medical Devices," by Mohammed N. Islam, pending filed Sep. 8, 2008. cited by applicant . U.S. Patent and Trademark Office, Office Action for U.S. Appl. No. 12/206,432, filed Sep. 8, 2008, Mohammed N, Islam, dated Mar. 12, 2009. cited by applicant . U.S. Patent and Trademark Office, Notice of Allowance and Fee(s) Due for U.S. Appl. No. 12/206,432, filed Sep. 8, 2008, Mohammed N. Islam, dated Aug. 28, 2009. cited by applicant . Sun, Y., C.F. Booker, S. Kumari, R.N. Day, M. Davidson, A. Periasamy, "Characterization of an orange acceptor fluorescent protein for sensitized spectral fluorescence resonant energy transfer microscopy using a white-light laser," Journal of Biomedical Optics, vol. 14, No. 5, paper 054009 (2009). cited by applicant . Borlinghaus, R., "Colours Count: how the challenge of fluorescence was solved in confocal microscopy," in Modern Research and Educational Topics in Microscopy, A. Mendez-Vilas and J. Diaz, eds, pp. 890-899, Formatex (2007). cited by applicant . Borlinghaus, R., "The White Confocal: Continuous Spectral Tuning in Excitation and Emission," in Optical Fluorescence Microscopy, A. Diaspro (Ed), Chapter 2, pp. 37-54, ISBN 978-3-642-15174-3, Springer-Verlag, Berlin (2011). cited by applicant . Borlinghaus, R.T., L. Kuschel, "White Light Laser: The Ultimate Source for Confocal Microscopy," http://www.leica-microsystems.com/science-lab/white-light-laser (Jun. 27, 2012). cited by applicant . Ziegler, U., A.G. Bittermann, M. Hoechli, "Introduction to Confocal Laser Scanning Microscopy (LEICA)," www.zmb.unizh.ch, May 29, 2013. cited by applicant . Hazen, K.H., M.A. Arnold, G.W. Small, "Measurement of glucose and other analytes in undiluted human serum with near-infrared transmission spectroscopy," Analytica Chimica Acta, vol. 371, pp. 255-267 (1998). cited by applicant . Malin, S.F., T.L. Ruchti, T.B. Blank, S.N. Thennadil, S.L. Monfre, "Noninvasive prediction of glucose by near-infrared diffuse reflectance spectroscopy," Clinical Chemistry, vol. 45, No. 9, pp. 1651-1658 (1999). cited by applicant . Thennadil, S.N., J.L. Rennert, B.J. Wenzel, K.H. Hazen, T.L. Ruchti, M.B. Block, "Comparison of glucose concentration in interstitial fluid, and capillary and venous blood during rapid changes in blood glucose levels," Diabetes Technology & Therapeutics, vol. 3, No. 3, pp. 357-365 (2001). cited by applicant . Troy, T.L., S.N. Thennadil, "Optical properties of human skin in the near infrared wavelength range of 1000 to 2200nm," Journal of Biomedical Optics, vol. 6, No. 2, pp. 167-176, (2001). cited by applicant . Blank, T.B., T.L. Ruchti, A.D. Lorenz, S.L. Monfre, M.R. Makarewicz, M. Mattu, K.H. Hazen, "Clinical results from a non-invasive blood glucose monitor," Optical Diagnostics and Sensing of Biological Fluids and Glucose and Cholesterol Monitoring II, A.V. Priezzhev and G.L. Cote, Editors, Proceedings of SPIE, vol. 4624, pp. 1019 (2002). cited by applicant . Yeh, S-J, C.F. Hanna, O.S. Khalil, "Monitoring blood glucose changes in cutaneous tissue by temperature-modulated localized reflectance measurements," Clinical Chemistry, vol. 49, No. 6, pp. 924-934 (2003). cited by applicant . Marbach, R., T. Koschinsky, F.A. Gries, H.M. Heise, "Noninvasive blood glucose assay by near-infrared diffuse reflectance spectroscopy of the human inner lip," Applied Spectroscopy, vol. 47, No. 7, pp. 875-881 (1993). cited by applicant . Enejder, A.M.K., T.G. Scecina, J. Oh, M. Hunter, W.C. Shih, S. Sasic, G.L. Horowitz, M.S. Feld, "Raman spectroscopy for noninvasive glucose measurements," Journal of Biomedical Optics, vol. 10, No. 3, 031114 (2005). cited by applicant . Olesberg, J.T., L. Liu, V.V. Zee, M.A. Arnold, "In vivo near-infrared spectroscopy of rat skin tissue with varying blood glucose levels," Analytic Chemistry, vol. 78, No. 1, pp. 215-223 (2006). cited by applicant . Olesberg, J.T., M.A. Arnold, C. Mermelstein, J. Schmitz, J. Wagner, "Tunable laser diode system for noninvasive blood glucose measurements," Applied Spectroscopy, vol. 59, No. 12, pp. 1480-1484 (2005). cited by applicant . Harman-Boehm, I. A. Gal, A.M. Raykhman, J.D. Zahn, E Naidis, Y. Mayzel, "Noninvasive glucose monitoring: a novel approach," Journal of Diabetes Science and Technology, vol. 3, No. 2 pp. 253-260 (2009). cited by applicant . Kim-K.D., G.S. Son, S.S. Lim, S.S. Lee, "Measurement of glucose level exploiting a relative optical absorption at discrete probe wavelengths," Japanese Journal of Applied Physics, vol. 48, 077001 (2009). cited by applicant . Smith, J.L., "The Pursuit of Noninvasive Glucose: Hunting the Deceitful Turkey," 2nd Edition, pp. 1-141 (2011). cited by applicant . Pezzaniti, J.L., T.W. Jeng, L. McDowell, G.M. Oosta, "Preliminary investigation of near-infrared spectroscopic measurements of urea, creatinine, glucose, protein and ketone in urine," Clinical Biochemistry, vol. 34, pp. 239-246 (2001). cited by applicant . Lussi, A., R. Hibst, R. Paulus, "Diagnodent: An optical method for caries detection," Journal of Dental Research, vol. 83, special issue C, pp. C80-C83 (2004). cited by applicant . Reese, E.L, E.E. Fisher, D.A. Horowitz, "Photoelectric densitometry of the circulation of the human dental pulp," The Journal of the Baltimore College of Dental Surgery, vol. 26, No. 1, pp. 6-18 (1971). cited by applicant . Zakian, C., I. Pretty, R. Ellwood, "Near-infrared hyperspectral imaging of teeth for dental caries detection," Journal of Biomedical Optics, vol. 16, No. 6, 064047 (2009). cited by applicant . Belikov, A.V., A.V. Skripnik, K.V. Shatilova, "Study of the dynamics of the absorption spectra of human tooth enamel and dentine under heating and ablation by submillisecond pulse radiation of an erbium laser with a generation wavelength of 2.79 um," Optics and Spectroscopy, vol. 109, No. 2, pp. 211-216 (2010). cited by applicant . Karlsson, L. "Caries detection methods based on changes in optical properties between healthy and carious tissue," International Journal of Dentistry, vol. 2010, Article ID 270729, 9 pages (2010). cited by applicant . Fried, D. M. Staninec, C.L. Darling, "Near-infrared imaging of dental decay at 1310nm," Journal of Laser Dentistry, vol. 18, No. 1, pp. 8-16 (2010). cited by applicant . Burmen, M. P. Usenik, A. Fidler, F. Pernus, B. Likar, "A construction of standardized near infrared hyper-spectral teeth database--a first step in the development of reliable diagnostic tool for quantification and early detection of caries," Lasers in Dentistry XVII, edited by P. Rechmann, D. Fried, Proceedings of SPIE, vol. 7884, Paper 78840E (2011). cited by applicant . Maia, A., L. Karlsson, W. Margulis, A. Gomes, "Evaluation of two imaging techniques: near-infrared transillumination and dental radiographs for the detection of early approximal enamel caries," Dentomaxillofacial Radiology, vol. 40, pp. 429-433 (2011). cited by applicant . Chung, S., D. Fried, M. Staninec, C.L. Darling, "Multispectral near-IR reflectance and transillumination imaging of teeth," Biomedical Optics Express, vol. 2, No. 10, pp. 2804-2814 (2011). cited by applicant . Chung, S., D. Fried, M. Staninec, C.L. Darling, "Near infrared imaging of teeth at wavelengths between 1200 and 1600nm," Proceedings of the Society of Photo Optical Instrument Engineering, paper 7884 (2011). cited by applicant . Staninec, M., S.M. Douglas, C.L. Darling, K. Chan, H. Kang, R. C. Lee, D. Fried, "Nondestructive clinical assessment of occlusal caries lesions using near-IR imaging methods," Lasers in Surgery and Medicine, vol. 43, No. 10, pp. 951-959 (2011). cited by applicant . Nishizawa, N., "Generation and application of high-quality supercontinuum sources," Optical Fiber Technology, vol. 18, pp. 394-402 (2012). cited by applicant . Hori, Takashi, et al., "Flatly broadened, wideband and low noise supercontinuum generation in highly nonlinear hybrid fiber", Optics Express, vol. 12, No. 2, Jan. 26, 2004, pp. 317-324. cited by applicant . Wadsworth, W. J., et al., "Supercontinuum and four-wave mixing with Q-switched pulses in endlessly single-mode photonic crystal fibres", Optics Express, vol. 12, No. 2, Jan. 26, 2004, pp. 299-309. cited by applicant . Hilligsoe, Karen Marie, et al., "Supercontinuum generation in a photonic crystal fiber with two zero dispersion wavelengths", Optics Express, vol. 12, No. 6, Mar. 22, 2004, pp. 1045-1054. cited by applicant . Venugopalan, V., "Optical Society of America BIOMED Topical Meeting Tutorial on Tissue Optics", Apr. 27, 2004, pp. 1-32. cited by applicant . Slusher, Richart E., et al., "Large Raman gain and nonlinear phase shifts in high-purity As2So3 chalcogenide fibers", J. Opt. Soc. Am. B, vol. 21, No. 6, Jun. 2004, pp. 1146-1155. cited by applicant . Leon-Saval, S. G., et al., "Supercontinuum generation in submicron fibre waveguides", Optics Express, vol. 12, No. 13, Jun. 28, 2004, pp. 2864-2869. cited by applicant . Nicholson, J. W., et al., "High power, single mode, all-fiber source of femtosecond pulses at 1550 nm and its use in supercontinuum generation", Optics Express, vol. 12, No. 13, Jun. 28, 2004, pp. 3025-3034. cited by applicant . Genty, G., et al., "Enhanced bandwidth of supercontinuum generated m microstructured fibers", Optics Express, vol. 12, No. 15, Jul. 26, 2004, pp. 3471-3480. cited by applicant . Champert, Pierre-Alain, et al., "White-light supercontinuum generation in normally dispersive optical fiber using original multi-wavelength pumping system", Optics Express, vol. 12, No. 19, Sep. 20, 2004, pp. 4366-4371. cited by applicant . Nicholson, J. W., "Supercontinuum generation in ultraviolet-irradiated fibers", Optics Letters, vol. 29, No. 20, Oct. 15, 2004, pp. 2363-2365. cited by applicant . Hori, Takashi, et al., "Experimental and numerical analysis of widely broadened supercontinuum generation in highly nonlinear dispersion-shifted fiber with a femtosecond pulse", J. Opt. Soc. Am. B, vol. 21, No. 11, Nov. 2004, pp. 1969-1980. cited by applicant . Demircan, Ayhan, et al., "Supercontinuum generation by the modulation instability", Optics Communications 244, 2005, pp. 181-185. cited by applicant . Papemyi, S. B., et al., "Sixth-Order Cascaded Raman Amplification", OFC/NFOEC, 2005, 3 pages. cited by applicant . Tanaka, Keiji, "Optical nonlinearity in photonic glasses", Journal of Materials Science: Materials in Electronics 16, 2005, pp. 633-643. cited by applicant . Westbrook, Paul S., "Improved Supercontinuum Generation Through UV Processing of Highly Nonlinear Fibers", Journal of Lightwave Technology, vol. 23, No. 1, Jan. 2005, pp. 13-18. cited by applicant . Abeeluck, Akheelesh K., et al., "Continuous-wave pumping in the anomalous- and normal dispersion regimes of nonlinear fibers for supercontinuum generatfon", Optics Letters, vol. 30, No. 1, Jan. 1, 2005, pp. 61-63. cited by applicant . Kutz, J. Nathan, et al., Enhanced Supercontinuum Generation through Dispersion-Management, Optics Express, vol. 13, No. 11, May 30, 2005, pp. 3989-3998. cited by applicant . Lee, Ju Han, et al., "Experimental performance comparison for various continuous-wave supercontinuum schemes: ring cavity and single pass structures", Optics Express, vol. 13, No. 13, Jun. 27, 2005, pp. 4848-4853. cited by applicant . Saliminia, A., et al., "Ultra-broad and coherent white light generation in silica glass by focused femtosecond pulses at 1.5pm", Optics Express, vol. 13, No. 15, Jul. 25, 2005, pp. 5731-5738. cited by applicant . Takushima, Yuichi, High average power, depolarized super-continuum generation using a 1.55-um ASE noise source, Optics Express, vol. 13, No. 15, Jul. 25, 2005, pp. 5871-5877. cited by applicant . Travers, J. C., et al., "Extended continuous-wave supercontinuum generation in a low-water-loss holey fiber", Optics Letters, vol. 30, No. 15, Aug. 1, 2005, pp. 1938-1940. cited by applicant . Kobtsev, Serguei M., et al., "Modelling of high-power supercontinuum generation in highly nonlinear, dispersion shifted fibers at CW pump", Optics Express, vol. 13, No. 18, Sep. 5, 2005, pp. 6912-6918. cited by applicant . Falk, Peter, et al., "Supercontinuum generation in a photonic crystal fiber with two zero-dispersion wavelengths tapered to normal dispersion at all wavelengths", Optics Express, vol. 13, No. 19, Sep. 19, 2005, pp. 7535-7540. cited by applicant . Tombelaine, Vincent, et al., "Ultra wide band supercontinuum generation in air-silica holey fibers by SHG-induced modulation instabilities", Optics Express, vol. 13, No. 19, Sep. 19, 2005, pp. 7399-7404. cited by applicant . Lee, Ju Han, et al., "Continuous-wave supercontinuum laser based on an erbium-doped fiber ring cavity incorporating a highly nonlinear optical fiber", Optics Letters, vol. 30, No. 19, Oct. 1, 2005, pp. 2599-2601. cited by applicant . Genty, G., et al., "Supercontinuum generation in large mode-area microstructured fibers", Optics Express, vol. 13, No. 21, Oct. 17, 2005, pp. 8625-8633. cited by applicant . Schreiber, T., et al., "Supercontinuum generation by femtosecond single and dual wavelength pumping in photonic crystal fibers with two zero dispersion wavelengths", Optics Express, vol. 13, No. 23, Nov. 14, 2005, pp. 9556-9569. cited by applicant . Travers, J. C., et al., "Extended blue supercontinuum generation in cascaded holey fibers", Optics Letters, vol. 30, No. 23, Dec. 1, 2005, pp. 3132-3134. cited by applicant . Hagen, C. L., et al., "Generation of a Continuum Extending to the Midinfrared by Pumping ZBLAN Fiber With an Ultrafast 1550-nm Source", IEEE Photonics Technology Letters, vol. 18, No. 1, Jan. 1, 2006, pp. 91-93. cited by applicant . Moon, Sucbei, et al., "Generation of octave-spanning supercontinuum with I550-nm amplified diode-laser pulses and a dispersion-shifted fiber", Optics Express, vol. 14, No. 1, Jan. 9, 2006, pp. 270-278. cited by applicant . Fedotova, O., et al., "Supercontinuum generation in planar rib waveguides enabled by anomalous dispersion", Optics Express, vol. 14, No. 4, Feb. 20, 2006, pp. 1512-1517. cited by applicant . Harrington, James A., "Infrared Fiber Optics", OSA Handbook, vol. III, white paper, to be published by McGraw Hill, Undated, 13 pages. cited by applicant . Aaviksoo, J., et al., "Observation of optical precursors at pulse propagation in GaAs", Physical Review A, vol. 44, No. 9, Nov. 1, 1991, pp. R5353-R5356. cited by applicant . Boppart, Stephen A., et al., "Imaging developing neural morphology using optical coherence tomography", Journal of Neuroscience Methods 70, 1996, pp. 65-72. cited by applicant . Boppart, Stephen A., et al., "Noninvasive assessment of the developing Xenopus cardiovascular system using optical coherence tomography", Prec. Natl. Acad. Sci. USA, vol. 94, Apr. 1997, pp. 4256-4261. cited by applicant . Tearney, Guillermo J., et al., "In vivo Endoscopic Optical Biopsy with Optical Coherence Tomography", Science, New Series, vol. 276, Jun. 27, 1997, pp. 2037-2039. cited by applicant . de Boer, Johannes F., et al., "Imaging thermally damaged tissue by polarization sensitive optical coherence tomography", Optics Express 212, vol. 3, No. 6, Sep. 14, 1998, pp. 212-218. cited by applicant . Roggan, Andre, et al., "Optical Properties of Circulating Human Blood in the Wavelength Range 400-2500 NM", Journal of Biomedical Optics, vol. 4, No. 1, Jan. 1999, pp. 36-46. cited by applicant . de Boer, Johannes F., et al., "Determination of the depth-resolved Stokes parameters of light backscattered from turbid media by use of polarization-sensitive optical coherence tomography", Optics Letters, vol. 24, No. 5; Mar. 1, 1999, pp. 300-302. cited by applicant . Rollins, Andrew M., et al., "Real-time in vivo imaging of human gastrointestinal ultrastructure by use of endoscopic optical coherence tomography with a novel efficient interferometer design", Optics Letters, vol. 24, No. 19, Oct. 1, 1999, pp. 1358-1360. cited by applicant . D'Amico, Anthony V., et al., "Optical Coherence Tomography as a Method for Identifying Benign and Malignant Microscopic Structures in the Prostate Gland", Basic Science, Urology 55 (5), 2000, pp. 783-787. cited by applicant . Li, Xingde, et al., "Imaging needle for optical coherence tomography", Optics Letters, vol. 25, No. 20, Oct. 15, 2000, pp. 1520-1522. cited by applicant . Oughstun, Kurt E., "Influence of precursor fields on ultrashort pulse autocorrelation measurements and pulse width evolution", Optics Express, vol. 8, No. 8, Apr. 9, 2001, pp. 481-491. cited by applicant . Kowalevicz, Andrew M., et al., "Ultrahigh resolution optical coherence tomography using a superluminescent light source" Optics Express 349, vol. 10, No. 7, Apr. 8, 2002, pp. 349-353. cited by applicant . Povazay, B., et al., "Submicrometer axial resolution optical coherence tomography", Optics Letters, vol. 27, No. 20, Oct. 15, 2002, pp. 1800-1802. cited by applicant . Xie, T.-Q., et al., "Detection of tumorigenesis in urinary bladder with optical coherence tomography: optical characterization of morphological changes", Optics Express, vol. 10, No. 24, Dec. 2, 2002, 2003, pp. 1431-1443. cited by applicant . Seefeldt, Michael, et al., "Compact white-light source with an average output power of 2.4 Wand 900 nm spectral bandwidth", Optics Communications 216, pp. 199-202. cited by applicant . Wang, Yimin, et al., "Ultrahigh-resolution optical coherence tomography by broadband continuum generation from a photonic crystal fiber", Optics Letters, vol. 28, No. 3, Feb. 1, 2003, pp. 182-184. cited by applicant . Bizheva, K, et al., "Compact, broad-bandwidth fiberlaserforsub-2-pm axial resolution optical coherence tomography in the 1300-nm wavelength region," Optics Letters, vol. 28, No. 9, May 1, 2003, pp. 707-709. cited by applicant . Vinay V. Alexander et al.; Modulation Instability High Power All-Fiber Supercontinuum Lasers and Their Applications; Optical Fiber Technology 18; 2012; pp. 349-374. cited by applicant . Robert S. Jones et al.; Near-Infrared Transillumination at 1310-nm for the Imaging of Early Dental Decay; vol. 11, No. 18; Optics Express 2259; Sep. 8, 2003. cited by applicant . Extended European Search Report for European Application No. 13867874.3 dated Jul. 15, 2016. cited by applicant . Extended European Search Report for European Application No. 13867892.5 dated Jul. 22, 2016. cited by applicant . Islam, M. N., et al., "Broad bandwidths from frequency-shifting solitons in fibers", Optics Letters, vol. 14, No. 7, Apr. 1, 1989, pp. 370-372. cited by applicant . Islam, M. N., et al., "Femtosecond distributed soliton spectrum in fibers", J. Opt. Soc. Am. B, vol. 6, No. 6, Jun. 1989, pp. 1149-1158. cited by applicant . Busse, Lynda E., et al., "Design Parameters for Fluoride Multimode Fibers", Journal of Lightwave Technology, vol. 9, No. 7, Jul. 1991, pp. 828-831. cited by applicant . Wuthrich, Stefan, et al., "Optical damage thresholds at 2.94 um in fluoride glass fibers", Applied Optics, vol. 31, No. 27, Sep. 20, 1992, pp. 5833-5837. cited by applicant . Inoue, H., et al., "Computer simulation of the vibrational spectra and properties of fluoride glasses based on ZrF4", Journal of Non-Crystalline Solids, vol. 161, 1993, pp. 118-122. cited by applicant . Mizunami, Toru, et al., "Gain saturation characteristics of Raman amplification in silica and fluoride glass optical fibers", Optics Communications 97, 1993, pp. 74-78. cited by applicant . Desthieux, B., et al., "111 kW (0. 5 mJ) pulse amplification at 1.5 um using a gated cascade of three erbium-doped fiber amplifiers," Appl. Phys. Lett. vol. 63, Aug. 2, 1993, pp. 586-588. cited by applicant . Edwards, Glenn, et al., Tissue ablation by a free-electron laser tuned to the amide II band, Nature, vol. 371, Sep. 29, 1994, pp. 416-419. cited by applicant . Borrelli, N. F., et al., "Resonant and non-resonant effects in photonic glasses", Journal of Non-Crystalline Solids 185, 1995, pp. 109-122. cited by applicant . Asobe, Masaki, et al., "Third-order nonlinear spectroscopy in As2S3 chalcogenide glass fibers", J. Appl. Phys. 77 (11), Jun. 1, 1995, pp. 5518-5523. cited by applicant . Jarman, Richard H., "Novel optical fiber lasers", Current Opinion in Solid State and Materials Science, 1996, pp. 199-203. cited by applicant . Iatridis, James C., et al., "Is the Nucleus Pulposus a Solid or a Fluid? Mechanical Behaviors of the Nucleus Pulposus of the Human Intervertebral Disc", Spine, vol. 21(10), May 15, 1996, pp. 1174-1184. cited by applicant . Asobe, Masaki, "Nonlinear Optical Properties of Chalcogenide Glass Fibers and Their Application to All-Optical Switching", Optical Fiber Technology, vol. 3, Article No. OF970214, 1997, pp. 142-148. cited by applicant . Smektala, F., et al., "Chalcogenide glasses with large non-linear refractive indices", Journal of Non-Crystalline Solids 239, 1998, pp. 139-142. cited by applicant . Hamilton, James D., et al., "High Frequency Ultrasound Imaging with Optical Arrays", IEEE Transactions on Ultrasonics, Ferroelectrics, and Frequency Control, vol. 45, No. 1, Jan. 1998, pp. 216-235. cited by applicant . Hamilton, James D., et al., "High Frequency Ultrasound Imaging Using an Active Optical Detector", IEEE Transactions on Ultrasonics, Ferroelectrics, and Frequency Control, vol. 45, No. 3, May 1998, pp. 719-727. cited by applicant . Nowak, G. A., et al., "Low-power high-efficiency wavelength conversion based on modulational instability in high-nonlinearity fiber," Optics Letters, vol. 23, No. 12, Jun. 15, 1998, pp. 936-938. cited by applicant . Cardinal, T., et al., "Non-linear optical properties of chalcogenide glasses in the system As--S--Se", Journal of Non-Crystalline Solids 256 & 257, 1999, pp. 353-360. cited by applicant . Lucas, Jacques, "Infrared glasses", Current Opinion in Solid State & Materials Science 4, 1999. pp. 181-187. cited by applicant . Sanghera, J. S., et al., Active and passive chalcogenide glass optical fibers for IR applications: a review, Journal of Non-Crystalline Solids 256 & 257, 1999, pp. 6-16. cited by applicant . Nishida, Yoshiki, et al., "Reliability of Fluoride Fiber Module for Optical Amplifier Use", IEEE Photonics Technology Letters, vol. 11, No. 12, Dec. 1999, pp. 1596-1598. cited by applicant . Nowak, George A., et al., "Stable supercontinuum generation in short lengths of conventional dispersion-shifted fiber", Applied Optics, vol. 38, No. 36, Dec. 20, 1999, pp. 7364-7369. cited by applicant . Urban, J. P. G., et al., "The Nucleus of the Intervertebral Disc from Development to Degeneration" Amer. Zool., vol. 40, 2000, pp. 53-61. cited by applicant . Hamilton, James D., et al., "High Frequency Optoacoustic Arrays Using Etalon Detection", IEEE Transactions on Ultrasonics, Ferroelectrics, and Frequency Control, vol. 47, No. 1, Jan. 2000, pp. 160-169. cited by applicant . Ranka, Jinendra K., et al., "Visible continuum generation in air-silica microstructure optical fibers with anomalous dispersion at 800 nm", Optics Letters, vol. 25, No. 1, Jan. 1, 2000, pp. 25-27. cited by applicant . Boult, Maggi, et al., "Systematic Review of Percutaneous Endoscopic Laser Discectomy: Update and Re-appraisal", Australian Safety and Efficacy Register of New Interventional Procedures--Surgical Report No. 5, Feb. 2000, 49 pages. cited by applicant . Boult, Maggi, et aL, "Percutaneous Endoscopic Laser Discectomy", Systematic Review, Aust. N.Z.J. Surg., vol. 70, Apr. 7, 2000, pp. 475-479. cited by applicant . Camacho, Nancy P., et al., "FTIR Microscopic Imaging of Collagen and Proteoglycan in Bovine Cartilage," Biopolymers (Biospectroscopy), vol. 62, 2001, pp. 1-8. cited by applicant . Choi, Joon Y., et al, "Thermal, Mechanical, Optical, and Morphologic Changes in Bovine Nucleus Pulposus Induced by Nd:YAG (.lamda.=1.32 um) Laser Irradiation", Lasers in Surgery and Medicine, vol. 28, 2001, pp. 248-254. cited by applicant . Hafez, M. I., et al., "The Effect of Irrigation on Peak Temperatures in Nerve Root, Dura, and Intervertebral Disc During Laser-Assisted Foraminoplasty", Lasers in Surgery and Medicine, vol. 29, 2001, pp. 33-37. cited by applicant . Jackson, Stuart D., et al., "Theory and numerical simulation of nth-order cascaded Raman fiber lasers", J. Opt. Soc. Am. B, vol. 18, No. 9, Sep. 2001, pp. 1297-1306. cited by applicant . Werle, Peter, et al., "Near- and mid-infrared laser-optical sensors for gas analysis", Optics and Lasers in Engineering 37, 2002, pp. 101-114. cited by applicant . Beck, Mattias, et al., "Continuous Wave Operation of a Mid-Infrared Semiconductor Laser at Room Temperature," Science vol. 295, www.sciencemag.org, Jan. 11, 2002, pp. 301-305. cited by applicant . Harbold, J. M., et al., "Highly nonlinear As--S--Se glasses for all-optical switching", Optics Letters, vol. 27, No. 2, Jan. 15, 2002, pp. 119-121. cited by applicant . Coen, Stephane, et al., "Supercontinuum generation by stimulated Raman scattering and parametric four-wave mixing in photonic crystal fibers", J. Opt. Soc. Am. B, vol. 19, No. 4, Apr. 2002, pp. 753-764. cited by applicant . Dudley, John M., et al., "Supercontinuum generation in air-silica microstructured fibers with nanosecond and femtosecond pulse pumping", J. Opt. Soc. Am. B, vol. 19, No. 4, Apr. 2002, pp. 765-771. cited by applicant . Harbold, Jeffrey M., et al., "Highly Nonlinear Ge--As--Se and.Ge--As--S--Se Glasses for All-Optical Switching", IEEE Photonics Technology Letters, vol. 14, No. 6, Jun. 2002, pp. 822-824. cited by applicant . Husakou, Anton V., et al, "Supercontinuum generation, four-wave mixing, and fission of higher-order solitons in photonic-crystal fibers", J. Opt. Soc. Am. B, vol. 19, No. 9, Sep. 2002, pp. 2171-2182. cited by applicant . Wadsworth, William J., et al., "Supercontinuum generation in photonic crystal fibers and optical fiber tapers: a novel light source", J. Opt. Soc. Am. B, vol. 19, No. 9, Sep. 2002, pp. 2148-2155. cited by applicant . Kumar, V.V. Ravi Kanth, et al, "Extruded soft glass photonic crystal fiber for ultrabroad supercontinuum generation", Optics Express, vol. 10, No. 25, Dec. 16, 2002, pp. 1520-1525. cited by applicant . Edwards, Glenn S., et al., "Advantage of the Mark-III FEL for biophysical research and biomedical applications", J. Synchrotron Rad. vol. 10, 2003, pp. 354-357. cited by applicant . Nicholson, J. W., et al., "Pulsed and continuous-wave supercontinuum generation in highly nonlinear, dispersion-shifted fibers", Applied Physics B 77, 2003, pp. 211-218. cited by applicant . Sobol, Emil, et al., "Time-resolved, light scattering measurements of cartilage and cornea denaturation due to free electron laser radiation", Journal of Biomedical Optics, vol. 8, No. 2, Apr. 2003, pp. 216-222. cited by applicant . Nicholson, J. W., et al., "All-fiber, octave-spanning supercontinuum", Optics Letters, vol. 28, No. 8, Apr. 15, 2003, pp. 643-645. cited by applicant . Faralli, S., et al., "Impact of Double Rayleigh Scattering Noise in Distributed Higher Order Raman Pumping Schemes", IEEE Photonics Technology Letters, vol. 15, No. 6, Jun. 2003, pp. 804-806. cited by applicant . "New and Emerging Techniques--Surgical, Rapid Review, Laser Discectomy", Australian Safety and Efficacy Register of New Interventional Procedures--Surgical, Jun. 2003, 12 pages. cited by applicant . Avdokhin, A. V., et al, "Continuous-wave, high-power, Raman continuum generation in holey fibers", Optics Letters, vol. 28, No. 15, Aug. 1, 2003, pp. 1353-1355. cited by applicant . Mussot, Arnaud, et al., "Generation of a broadband single-mode supercontinuum in a conventional dispersion-shifted fiber by use of a subnanosecond microchip laser", Optics Letters, vol. 28, No. 19, Oct. 1, 2003, pp. 1820-1822. cited by applicant . Slusher, Richard, et al., "Highly nonlinear composite chalcogenide/polymer fibers", OSA 2004, 1 page. cited by applicant . Thongtrangan, Issada, et al., "Minimally invasive spinal surgery: a historical perspective", Neurosurg. Focus, vol. 16, Article 13, Jan. 2004, pp. 1-10. cited by applicant . "Application Brief AB-070: The role of infrared microprobe analysis in forensic drug analysis," www.smithsdetection.com, Jun. 27, 2005. cited by applicant . Jasco Application Note No. 200DR0188-E, "Rapid Identification of illegal drug using NIR (identification of MDMA tablet)", Sep. 4, 2008. cited by applicant . Palou, A. J. Cruz, M. Blanco, J. Tomas, J. De Los Rios, M. Alcala, "Determination of drug, excipients and coating distribution in pharmaceutical tablets using NIR-CI," Journal of Pharmaceutical Analysis, vol. 2, No. 2, pp. 90-97 (2012). cited by applicant . Arnold, T., M. De Biasio, R. Leitner, "Near-Infrared Imaging Spectroscopy for Counterfeit Drug Detection," Next Generation Spectroscopic Technologies IV, edited by M. A. Druy, R.A. Crocombe, Proceedings of SPIE, vol. 8032, 80320Y-1 to 7, (2011). cited by applicant . Wedding, B.B., C. Wright, S. Grauf, R.D. White, "The application of near infrared spectroscopy for the assessment of avocado quality attributes," Infrared Spectroscopy--Life and Biomedical Sciences, pp. 211-230 (2011). cited by applicant . Michaels, C.A., T. Masiello, P.M. Chu, "Fourier transform spectrometry with a near infrared supercontinuum source," Optical Society of America, CLEO/IQEC Conference, paper CMDD6 (2009). cited by applicant . Michaels, C.A., T. Masiello, P.M. Chu, "Fourier transform spectrometry with a near-infrared supercontinuum source," Applied Spectroscopy, vol. 63, No. 5, pp. 538-543 (2009). cited by applicant . Moros,J., J. Kuligowski, G. Quintas, S. Garrigues, M. DeLa Guardia, "New cut-off criterion for uninformative variable elimination in multivariate calibration of near-infrared spectra for the determination of heroin in illicit street drugs," Analytica Chimica Acta, vol. 630, pp. 150-160 (2008). cited by applicant . Moros, J. N. Gallpienso, R. Vilches, S. Garrigues, M. DeLa Guardia, "Nondestructive direct determination of heroin in seized illicit street drugs by diffuse reflectance near-infrared spectroscopy," Analytical Chemistry, vol. 80, No. 19, pp. 7257-7265 (Oct. 1, 2008). cited by applicant . Roggo, Y. P. Chalus, L. Maurer, C. Lema-Martinez, A. Edmond, N. Jent, "A review of near infrared spectroscopy and chemometrics in pharmaceutical technologies," Journal of Pharmaceutical and Biomedical Analysis, vol. 44, pp. 683-700 (2007). cited by applicant . Pojic, M. J. Mastilovic, N. Majcen, "The application of near infrared spectroscopy in wheat quality control," Infrared Spectroscopy--Life and Biomedical Sciences, pp. 167-184 (2012). cited by applicant . Reich, G. "Near-infrared spectroscopy and imaging: basic principles and pharmaceutical applications," Advanced Drug Delivery Reviews, vol. 57, pp. 1109-1143 (2005). cited by applicant . Rodionova, O.Y., L.P. Houmoller, A.L. Pomerantsev, P. Geladi, J. Burger, V.L. Dorofeyev, A.P. Arzamastsev, "NIR spectrometry for counterfeit drug detection: a feasibility study," Analytica Chimica Acta, vol. 549, pp. 151-158 (2005). cited by applicant . Schneider, R.C., K.A. Kovar, "Analysis of ecstasy tablets: comparison of reflectance and transmittance near infrared spectroscopy," Forensic Science International, vol. 134, pp. 187-195 (2003). cited by applicant . Olsen, B.A., M.W. Borer, F.M. Perry, R.A. Forbes, "Screening for counterfeit drugs using near-infrared spectroscopy," Pharmaceutical Technology, pp. 62-71 (Jun. 2002). cited by applicant . Scafi, S.H.F., C. Pasquini, "Identification of counterfeit drugs using near-infrared spectroscopy," Analyst, vol. 126, pp. 2218-2224 (2001). cited by applicant . Sondermann, N., K.A. Kovar, "Identification of ecstasy in complex matrices using near-infrared spectroscopy," Forensic Science International, vol. 102, pp. 133-147 (1999). cited by applicant . Rambla, F.J., S. Garrigues, M. DeLa Guardia, "PLS-NIR determination of total sugar, glucose, fructose and sucrose in aqueous solutions of fruit juices," Analytica Chimica Acta, vol. 344, pp. 41-53 (1997). cited by applicant . Istepanian, Robert H., "The Comparative Performance of Mobile Telemedical Systems based on the IS-54 and GSM Cellular Telephone Standards"; Journal of Telemedicine and Telecare 1999; pp. 97-104. cited by applicant . Aris, Ishak Bin, "An Internet-Based Blood Pressure Monitoring System for Patients"; Journal of Telemedicine and Telecare 2001; pp. 51-53. cited by applicant . J.G. Webster; Design of Pulse Oximeters; Medical Science Series; Taylor & Francis Group; CRC Press; Oct. 23, 1997; 260 pps. cited by applicant . H. Harry Asada et al.; Mobile Monitoring With Wearable Photoplethysmographic Biosensors; IEEE Engineering In Medicine and Biology Magazine, Jun. 2003; 13 pps. cited by applicant . United States District Court Eastern District of Texas Marshall Division; Defendant and Counter Claimant Apple Inc.'s Amended Answer, Affirmative Defenses, and Counterclaims to Complaint of Plaintiff and Counter Defendant Omni Medsci, Inc.; Document 38; Jul. 19, 2018; 32 pps. cited by applicant . Omni Medsci, Inc. V. Apple Inc.; Case No. 2:18-cv-134-RWS (E.D. Tex.); Defendant's Invalidity Contentions, Aug. 28, 2018 (Exhibit A), 66 pps. cited by applicant . Omni Medsci, Inc. V. Apple Inc.; Case No. 2:18-cv-134-RWS (E.D. Tex.); Defendant's Invalidity Contentions, Aug. 28, 2018 (Exhibit B), 73 pps. cited by applicant . Omni Medsci, Inc. V. Apple Inc.; Case No. 2:18-cv-134-RWS (E.D. Tex.); Defendant's Invalidity Contentions, Aug. 28, 2018 (Exhibit C), 85 pps. cited by applicant . Omni Medsci, Inc. V. Apple Inc.; Case No. 2:18-cv-134-RWS (E.D. Tex.); Defendant's Invalidity Contentions, Aug. 28, 2018 (Exhibit D), 38 pps. cited by applicant . Omni Medsci, Inc. V. Apple Inc.; Case No. 2:18-cv-134-RWS (E.D. Tex.); Defendant's Invalidity Contentions, Aug. 28, 2018 (Exhibit E), 120 pps. cited by applicant . Omni Medsci, Inc. V. Apple Inc.; Case No. 2:18-cv-134-RWS (E.D. Tex.); Defendant's Invalidity Contentions, Aug. 28, 2018 (Exhibit F), 40 pps. cited by applicant . Omni Medsci, Inc. V. Apple Inc.; Case No. 2:18-cv-134-RWS (E.D. Tex.); Defendant's Invalidity Contentions, Aug. 28, 2018 (Exhibit G), 66 pps. cited by applicant . Omni Medsci, Inc. V. Apple Inc.; Case No. 2:18-cv-134-RWS (E.D. Tex.); Defendant's Invalidity Contentions, Aug. 28, 2018 (Exhibit H), 74 pps. cited by applicant . Omni Medsci, Inc. V. Apple Inc.; Case No. 2:18-cv-134-RWS (E.D. Tex.); Defendant's Invalidity Contentions, Aug. 28, 2018 (Exhibit I), 102 pps. cited by applicant . Omni Medsci, Inc. V. Apple Inc.; Case No. 2:18-cv-134-RWS (E.D. Tex.); Defendant's Invalidity Contentions, Aug. 28, 2018 (Exhibit J), 64 pps. cited by applicant . Omni Medsci, Inc. V. Apple Inc.; Case No. 2:18-cv-134-RWS (E.D. Tex.); Defendant's Invalidity Contentions, Aug. 28, 2018 (Exhibit K), 77 pps. cited by applicant . Omni Medsci, Inc. V. Apple Inc.; Case No. 2:18-cv-134-RWS (E.D. Tex.); Defendant's Invalidity Contentions, Aug. 28, 2018 (Exhibit L), 64 pps. cited by applicant . Omni Medsci, Inc. V. Apple Inc.; Case No. 2:18-cv-134-RWS (E.D. Tex.); Defendant's Invalidity Contentions, Aug. 28, 2018 (Exhibit M), 119 pps. cited by applicant . Omni Medsci, Inc. V. Apple Inc.; Case No. 2:18-cv-134-RWS (E.D. Tex.); Defendant's Invalidity Contentions, Aug. 28, 2018 (Exhibit N), 50 pps. cited by applicant . Omni Medsci, Inc. V. Apple Inc.; Case No. 2:18-cv-134-RWS (E.D. Tex.); Defendant's Invalidity Contentions, Aug. 28, 2018 (Exhibit O), 63 pps. cited by applicant . Omni Medsci, Inc. V. Apple Inc.; Case No. 2:18-cv-134-RWS (E.D. Tex.); Defendant's Invalidity Contentions, Aug. 28, 2018 (Exhibit P), 78 pps. cited by applicant . Omni Medsci, Inc. V. Apple Inc.; Case No. 2:18-cv-134-RWS (E.D. Tex.); Defendant's Invalidity Contentions, Aug. 28, 2018 (Exhibit Q), 69 pps. cited by applicant . Omni Medsci, Inc. V. Apple Inc.; Case No. 2:18-cv-134-RWS (E.D. Tex.); Defendant's Invalidity Contentions, Aug. 28, 2018 (Exhibit R), 61 pps. cited by applicant . Omni Medsci, Inc. V. Apple Inc.; Case No. 2:18-cv-134-RWS (E.D. Tex.); Defendant's Invalidity Contentions, Aug. 28, 2018 (Exhibit S), 50 pps. cited by applicant . Omni Medsci, Inc. V. Apple Inc.; Case No. 2:18-cv-134-RWS (E.D. Tex.); Defendant's Invalidity Contentions, Aug. 28, 2018 (Exhibit T), 174 pps. cited by applicant . Omni Medsci, Inc. V. Apple Inc.; Case No. 2:18-cv-134-RWS (E.D. Tex.); Defendant's Invalidity Contentions, Aug. 28, 2018 (Exhibit U), 334 pps. cited by applicant . Omni Medsci, Inc. V. Apple Inc.; Case No. 2:18-cv-134-RWS (E.D. Tex.); Defendant's Invalidity Contentions, Aug. 28, 2018 (Exhibit V), 137 pps. cited by applicant . Omni Medsci, Inc. V. Apple Inc.; Case No. 2:18-cv-134-RWS (E.D. Tex.); Defendant's Invalidity Contentions, Aug. 28, 2018 (Exhibit W), 384 pps. cited by applicant . Omni Medsci, Inc. V. Apple Inc.; Case No. 2:18-cv-134-RWS (E.D. Tex.); Defendant's Invalidity Contentions, Aug. 28, 2018 (Exhibit X), 291 pps. cited by applicant . Omni Medsci, Inc. V. Apple Inc.; Case No. 2:18-cv-134-RWS (E.D. Tex.); Defendant's Invalidity Contentions, Aug. 28, 2018 (Exhibit Y), 120 pps. cited by applicant . Omni Medsci, Inc. V. Apple Inc.; Case No. 2:18-cv-134-RWS (E.D. Tex.); Defendant's Invalidity Contentions, Aug. 28, 2018 (Exhibit Z), 53 pps. cited by applicant . Omni Medsci, Inc. V. Apple Inc.; Case No. 2:18-cv-134-RWS (E.D. Tex.); Defendant's Invalidity Contentions, Aug. 28, 2018 (Exhibit AA), 75 pps. cited by applicant . Omni Medsci, Inc. V. Apple Inc.; Case No. 2:18-cv-134-RWS (E.D. Tex.); Defendant's Invalidity Contentions, Aug. 28, 2018 (Exhibit BB), 65 pps. cited by applicant . Omni Medsci, Inc. V. Apple Inc.; Case No. 2:18-cv-134-RWS (E.D. Tex.); Defendant's Invalidity Contentions, Aug. 28, 2018 (Exhibit CC), 320 pps. cited by applicant . Omni Medsci, Inc. V. Apple Inc.; Case No. 2:18-cv-134-RWS (E.D. Tex.); Defendant's Invalidity Contentions, Aug. 28, 2018 (Exhibit DD), 240 pps. cited by applicant . Rhee et al., Artifact-Resistant Power-Efficient Design of Finger-Ring Plelhysmographic Sensors, IEEE Transactions on Biomedical Engineering (Jul. 2001), vol. 48, No. 7, Cambridge, MA, 11 pages. cited by applicant . Branche et al., Signal Quality and Power Consumption of a New Prototype Reflectance Pulse Oximeter Sensor, Proceedings of the IEEE 31st Annual Northeast Bioengineering Conference (2005), Hoboken, NJ, 2 pages. cited by applicant . Pelaez, LED Power Reduction Trade-Offs for Ambulatory Pulse Oximetry, Conference Proceedings of the 29th Annual International Conference of the IEEE EMBS (Aug. 2007) Lyon, France, 4 pages. cited by applicant . Luo et al., A Non-Invasive Dual-Channel Oximeter Based on Near-Infrared Spectroscopy (NIRS), Biophotonics Lab, Center of Advanced Research in Photonics (2007), The Chinese University of Hong Kong, China, 2 pages. cited by applicant . Asada et al., The MIT Ring: History, Technology, and Challenges of Wearable Health Monitoring, MIT Industrial Liaison Program (2010) R&D Conference, MA, 72 pages. cited by applicant . Asada et al., Mobile Monitoring with Wearable Photoplethysmographic Biosensors, Technical and Clinical Aspects of a Ring Sensor for Ambulatory, Telemetric, Continuous Health Monitoring in the Field, in the Hospital, and in the Home, EEE Engineering in Medicine and Biology Magazine, (May/Jun. 2003) 13 pages. cited by applicant . Schreiner et al., Blood Oxygen Level Measurement with a Chest-Based Pulse Oximetry Prototype System, Computing in Cardiology (2010) NIBEC, University of Ulster, Newtownabbey, Northern Ireland, 4 pages. cited by applicant . GE Healthcare, TuffSat User's Guide and Service Manual Electromagnetic Compatibility (EMC), (Mar. 2005) Helsinki, Finland, 43 pages. cited by applicant . Kurylyak et al., Smartphone-Based Photoplethysmogram Measurement, Department of Electronis, Computer and System Sciences, (2012) River Publishers, University of Calabria, Italy, 30 pages. cited by applicant . Patterson et al., Ratiometric Artifact Reduction in Low Power Reflective Photoplethysmography, (Aug. 2011) IEEE Transactions on Biomedical Circuits and Systems, vol. 5, No. 4, 9 pages. cited by applicant . Cai et al., Implementation of a Wireless Pulse Oximeter Based on Wrist Band Sensor, College of Biological Science and Medical Engineering Southeast University, (2010) 3rd International Conference on Biomedical Engineering and Informatics, Nanjing, China, 4 pages. cited by applicant . Yamaha, BODiBEAT, Body, Music, In Sync., BF-1 Quick Guide, Player/Heart Rate Monitor: Quick Manual, 120 pages. cited by applicant . GE Healthcare, GE Ohmeda TufSat Oximeter for Clinicians on the go, (2012), A General Electric Co., www.gehealthcare.com, GE, Finland, 4 pages. cited by applicant . Wang et al., Multichannel Reflective PPG Earpiece Sensor with Passive Motion Cancellation, (Dec. 2007) IEEE Transactions on Biomedical Circuits and Systems, vol. 1, No. 4, 7 pages. cited by applicant . Webster, Design of Pulse Oximeters, Medical Science Series (1997), Department of Electrical and Computer Engineering, University of Wisconsin--Madison, Institute of Physics Publishing, Bristol and Philadelphia, 267 pages. cited by applicant . Taos, Inc., Infrared Light-to-Voltage Optical Sensors, (2006) Texas Advanced Optoelectronic Solutions Inc., The Lumenology Company, TX, 14 pages. cited by applicant . Jung et al., Design of A Low-Power Consumption Wearable Reflectance Pulse Oximetry for Ubiquitous Healthcare System, International Conference on Control, Automation and Systems (Oct. 2008), in COEX, Seoul, Korea, 4 pages. cited by applicant . Embedded-Lab, Introducing Easy Pulse: A DIY Photoplethysmographic Sensor for Measuring Hearth Rate, posted on www.Embedded-Lab.com Sep. 12, 2012, by R-B, 10 pages. cited by applicant . Asare et al., Analysis of Multi-Spectral Photoplethysmograph Biosensors, Proc. SPIE 8801, Novel Biophotonic Techniques and Applications ll, 880106 (Jun. 2013), European Conferences on Biomedical Optics, Munich, Germany, 7 pages. cited by applicant . Moron et al, A Wireless Monitoring System for Pulse-Oximetry Sensors, (2005) Electronic Technology Department, University of Malaga, Spain, 6 pages. cited by applicant . Li et al, A Wireless Reflective Pulse Oximeter with Digital Baseline Control for Unfiltered Photoplethysmograms, (Jun. 2012) IEEE Transactions on Biomedical Circuits and Systems, vol. 6, No. 3, 10 pages. cited by applicant . Humphreys et al., Noncontact Simultaneous Dual Wavelength Photoplethysmography: A Further Step Toward Noncontact Pulse Oximetry, (2007) Review of Scientific Instruments 78, 044304, American Institute of Physics, 6 pages. cited by applicant . Mendelson et al., A Wearable Reflectance Pulse Oximeter for Remote Physiological Monitoring, (Aug./Sep. 2006) Proceedings of the 28th IEEE EMBS Annual International Conference New York City, NY, 4 pages. cited by applicant . United States District Court Eastern District of Texas Marshall Division; Omni Medsci, Inc. vs. Apple Inc.; Civil Action No. 2:18-cv-00134 Jury Trial Demanded; Defendant's Invalidity Contentions; Aug. 28, 2018; 33 pps cited by applicant. |
Primary Examiner: Rahman; Md M
Attorney, Agent or Firm: Brooks Kushman P.C.
Parent Case Text
CROSS-REFERENCE TO RELATED APPLICATIONS
This application is a continuation of U.S. application Ser. No. 14/875,709 filed Oct. 6, 2015, which is a continuation of U.S. application Ser. No. 14/108,986 filed Dec. 17, 2013, now U.S. Pat. No. 9,164,032 issued Oct. 20, 2015, which claims the benefit of U.S. provisional application Ser. No. 61/747,487 filed Dec. 31, 2012, the disclosures of which are hereby incorporated in their entirety by reference herein.
This application is related to U.S. provisional application Ser. No. 61/747,477 filed Dec. 31, 2012; Ser. No. 61/747,481 filed Dec. 31, 2012; Ser. No. 61/747,485 filed Dec. 31, 2012; Ser. No. 61/747,472 filed Dec. 31, 2012; Ser. No. 61/747,492 filed Dec. 31, 2012; Ser. No. 61/747,553 filed Dec. 31, 2012; and Ser. No. 61/754,698 filed Jan. 21, 2013, the disclosures of which are hereby incorporated in their entirety by reference herein.
This application is also related to International Application No. PCT/US2013/075700 (Publication No. WO/2014/105520) entitled Near-Infrared Lasers For Non-Invasive Monitoring Of Glucose, Ketones, HBA1C, And Other Blood Constituents; International Application PCT/US2013/075736 (Publication No. WO/2014/105521) entitled Short-Wave Infrared Super-Continuum Lasers For Early Detection Of Dental Caries; U.S. application Ser. No. 14/108,995 (Publication No. 2014/0188092) entitled Focused Near-Infrared Lasers For Non-Invasive Vasectomy And Other Thermal Coagulation Or Occlusion Procedures; International Application PCT/US2013/075767 (Publication No. WO/2014/143276) entitled Short-Wave Infrared Super-Continuum Lasers For Natural Gas Leak Detection, Exploration, And Other Active Remote Sensing Applications; U.S. application Ser. No. 14/108,974 (Publication No. 2014/0188094) entitled Non-Invasive Treatment Of Varicose Veins; and U.S. application Ser. No. 14/109,007 (Publication No. 2014/0236021) entitled Near-Infrared Super-Continuum Lasers For Early Detection Of Breast And Other Cancers, the disclosures of which are hereby incorporated in their entirety by reference herein.
Claims
What is claimed is:
1. A system comprising: a light source comprising a plurality of light emitting diodes, each of the light emitting diodes configured to generate an output optical beam having one or more optical wavelengths, wherein at least a portion of the one or more optical wavelengths is a near-infrared wavelength between 700 nanometers and 2500 nanometers; a lens positioned to receive at least a portion of at least one of the output optical beams and to deliver a lens output beam to tissue; a detection system located to receive at least a portion of the lens output beam reflected from the tissue and configured to generate an output signal based on the received portion of the lens output beam reflected from the tissue, the output signal having a signal-to-noise ratio, wherein the detection system is further configured to be synchronized to the light source; a personal device comprising a wireless receiver, a wireless transmitter, a display, a microphone, a speaker, one or more buttons or knobs, a microprocessor, and a touch screen, the personal device configured to receive and process at least a portion of the output signal, wherein the personal device is configured to store and display the processed output signal, and wherein at least a portion of the processed output signal is configured to be transmitted over a wireless transmission link; and a remote device configured to receive over the wireless transmission link an output status comprising the at least a portion of the processed output signal, to process the received output status to generate processed data, and to store the processed data; wherein the output signal is indicative of one or more physiological parameters, and the remote device is configured to store a history of at least a portion of the one or more physiological parameters over a specified period of time; the light source configured to improve the signal-to-noise ratio of the output signal by increasing light intensity relative to an initial light intensity from at least one of the plurality of light emitting diodes and by increasing pulse rate relative to an initial pulse rate of at least one of the plurality of light emitting diodes; wherein the detection system includes a plurality of spatially separated detectors, wherein at least one analog to digital converter is coupled to at least one of the spatially separated detectors and is configured to generate at least two data signals, and the system is configured to further improve the signal-to-noise ratio by differencing two of the at least two data signals; and wherein the detection system further comprises one or more spectral filters positioned in front of at least some of the plurality of spatially separated detectors.
2. The system of claim 1 wherein the detection system is further configured to: detect light while the light emitting diodes are off and generate a corresponding first signal; detect light while at least one of the light emitting diodes is on and generate a corresponding second signal; and further improve the signal-to-noise ratio of the output signal by differencing the first signal and the second signal.
3. The system of claim 1 wherein the output signal is generated by using a Fourier transform.
4. The system of claim 1 further comprising a reflective surface positioned to reflect at least a portion of light reflected from the tissue.
5. The system of claim 4, wherein the spatially separated detectors include at least one detector located at a distance from a first one of the light emitting diodes and at a different distance from a second one of the light emitting diodes, and is configured to generate a third signal responsive to light from the first light emitting diode and a fourth signal responsive to light from the second light emitting diode.
6. The system of claim 5, wherein the output signal is generated in part by comparing the third and fourth signals.
7. A system for measuring one or more physiological parameters comprising: a light source comprising a plurality of semiconductor sources that are light emitting diodes, each of the light emitting diodes configured to generate an output optical beam having one or more optical wavelengths, wherein at least a portion of the one or more optical wavelengths is a near-infrared wavelength between 700 nanometers and 2500 nanometers; a lens configured to receive a portion of at least one of the output optical beams and to deliver a lens output beam to tissue; a detection system configured to receive at least a portion of the lens output beam reflected from the tissue and to generate an output signal having a signal-to-noise ratio, wherein the detection system is configured to be synchronized to the light source; a personal device comprising a wireless receiver, a wireless transmitter, a display, a microphone, a speaker, one or more buttons or knobs, a microprocessor and a touch screen, the personal device configured to receive and process at least a portion of the output signal, wherein the personal device is configured to store and display the processed output signal, and wherein at least a portion of the processed output signal is configured to be transmitted over a wireless transmission link; a remote device configured to receive over the wireless transmission link an output status comprising the at least a portion of the processed output signal, to process the received output status to generate processed data, and to store the processed data; wherein the output signal is indicative of one or more of the physiological parameters, and the remote device is configured to store a history of at least a portion of the one or more physiological parameters over a specified period of time; the system configured to increase the signal-to-noise ratio by increasing light intensity of at least one of the plurality of semiconductor sources from an initial light intensity and by increasing a pulse rate of at least one of the plurality of semiconductor sources from an initial pulse rate; and the detection system further configured to: generate a first signal responsive to light while the light emitting diodes are off, generate a second signal responsive to light received while at least one of the light emitting diodes is on, and increase the signal-to-noise ratio by differencing the first signal and the second signal.
8. The system of claim 4, wherein the detection system is located at a distance from a first one of the light emitting diodes and at a different distance from a second one of the light emitting diodes such that the detection system receives a third signal from the first light emitting diode and a fourth signal from the second light emitting diode.
9. The system of claim 5, wherein the output signal is generated in part by comparing the third and fourth signals.
10. The system of claim 7, further comprising a reflective surface configured to reflect at least a portion of light reflected from the tissue.
11. The system of claim 7 wherein the detection system comprises a plurality of spatially separated detectors.
12. The system of claim 11 wherein at least one of the spatially separated detectors is located at a distance from a first one of the light emitting diodes and at a different distance from a second one of the light emitting diodes, and is configured to generate a third signal responsive to light from the first light emitting diode and a fourth signal responsive to light from the second light emitting diode.
13. The system of claim 12 wherein the output signal is generated in part by comparing the third and fourth signals.
14. The system of claim 13 further comprising a reflective surface positioned to reflect at least a portion of light reflected from the tissue.
15. A system comprising: a light source comprising a plurality of semiconductor sources that are light emitting diodes, each of the light emitting diodes configured to generate an output optical beam having one or more optical wavelengths, wherein at least a portion of the one or more optical wavelengths is a near-infrared wavelength between 700 nanometers and 2500 nanometers; a lens configured to receive at least a portion of at least one of the output optical beams and to deliver a lens output beam to tissue; a reflective surface configured to receive and redirect at least a portion of light reflected from the tissue; a detection system configured to receive at least a portion of the lens output beam reflected from the tissue and to generate an output signal having a signal-to-noise ratio, wherein the detection system is configured to be synchronized to the light source; a personal device comprising a wireless receiver, a wireless transmitter, a display, a microphone, a speaker, one or more buttons or knobs, a microprocessor and a touch screen, the personal device configured to receive and process at least a portion of the output signal, wherein the personal device is configured to store and display the processed output signal, and wherein at least a portion of the processed output signal is configured to be transmitted over a wireless transmission link; and a remote device configured to receive over the wireless transmission link an output status comprising the at least a portion of the processed output signal, to process the received output status to generate processed data, and to store the processed data; wherein the output signal represents one or more physiological parameters, and the remote device is configured to store a history of at least a portion of the one or more physiological parameters over a specified period of time; the system configured to improve the signal-to-noise ratio by increasing light intensity from at least one of the light emitting diodes relative to an initial light intensity and by increasing a pulse rate of at least one of the light emitting diodes relative to an initial pulse rate; and the detection system further configured to: generate a first signal corresponding to light detected while the light emitting diodes are off, generate a second signal corresponding to light detected while at least one of the light emitting diodes is on, and increase the signal-to-noise ratio by differencing the first signal and the second signal.
16. The system of claim 15, wherein the detection system comprises at least on detector located at a distance from a first one of the light emitting diodes and at a different distance from a second one of the light emitting diodes such that the at least one detector generates a third signal from light from the first light emitting diode and a fourth signal from light from the second light emitting diode.
17. The system of claim 9, wherein the output signal is generated in part by comparing the third and fourth signals.
18. The system of claim 8, wherein the remote device is further configured to transmit at least a portion of the processed data to one or more other locations, wherein the one or more other locations is selected from the group consisting of the personal device, a doctor, a healthcare provider, a cloud-based server, and one or more designated recipients, and wherein the remote device is configured to transmit information related to a time and a position associated with the at least a portion of the processed data.
19. The system of claim 8, wherein at least one of the light emitting diodes emits light having a bandwidth between 20 nanometers and 40 nanometers.
20. The system of claim 8, further comprising one or more spectral filters positioned in front of one or more receivers of the detection system.
Description
BACKGROUND AND SUMMARY
Counterfeiting of pharmaceuticals is a significant issue in the healthcare community as well as for the pharmaceutical industry worldwide. For example, according to the World Health Organization, in 2006 the market for counterfeit drugs worldwide was estimated at around $43 Billion. Moreover, the use of counterfeit medicines may result in treatment failure or even death. For instance, in 1995 dozens of children in Haiti and Nigeria died after taking counterfeit medicinal syrups that contained diethylene glycol, an industrial solvent. As another example, in Asia one report estimated that 90% of Viagra sold in Shanghai, China, was counterfeit. With more pharmaceuticals being purchased through the internet, the problem of counterfeit drugs coming from across the borders into the United States has been growing rapidly.
A rapid, non-destructive, non-contact optical method for screening or identification of counterfeit pharmaceuticals is needed. Spectroscopy using near-infrared or short-wave infrared (SWIR) light may provide such a method, because most pharmaceuticals comprise organic compounds that have overtone or combination absorption bands in this wavelength range (e.g., between approximately 1-2.5 microns). Moreover, most drug packaging materials are at least partially transparent in the near-infrared or SWIR, so that drug compositions may be detected and identified through the packaging non-destructively. Also, using a near-infrared or SWIR light source with a spatially coherent beam permits screening at stand-off or remote distances. Beyond identifying counterfeit drugs, the near-infrared or SWIR spectroscopy may have many other beneficial applications. For example, spectroscopy may be used for rapid screening of illicit drugs or to implement process analytical technology in pharmaceutical manufacturing. There are also a wide array of applications in assessment of quality in the food industry, including screening of fruit, vegetables, grains and meats.
In one embodiment, a near-infrared or SWIR super-continuum (SC) source may be used as the light source for spectroscopy, active remote sensing, or hyper-spectral imaging. One embodiment of the SWIR light source may be an all-fiber integrated SWIR SC source, which leverages the mature technologies from the telecommunications and fiber optics industry. Exemplary fiber-based super-continuum sources may emit light in the near-infrared or SWIR between approximately 1.4-1.8 microns, 2-2.5 microns, 1.4-2.4 microns, 1-1.8 microns, or any number of other bands. In particular embodiments, the detection system may be a dispersive spectrometer, a Fourier transform infrared spectrometer, or a hyper-spectral imaging detector or camera. In addition, reflection or diffuse reflection light spectroscopy may be implemented using the SWIR light source, where the spectral reflectance can be the ratio of reflected energy to incident energy as a function of wavelength.
In one embodiment, a device includes a light source comprising a plurality of light emitting diodes, each of the LEDs configured to generate an output optical beam having one or more optical wavelengths, wherein at least a portion of the one or more optical wavelengths is a near-infrared wavelength between 700 nanometers and 2500 nanometers. A lens is positioned to receive at least a portion of at least one of the output optical beams and to deliver a lens output beam to tissue. A reflective surface is positioned to receive and redirect at least a portion of light reflected from the tissue. A detection system is located to receive at least a portion of the lens output beam reflected from the tissue and configured to generate an output signal, having a signal-to-noise ratio, in response, wherein the output signal is generated by using a Fourier transform and mathematical manipulation of a signal resulting from the lens output beam, wherein the detection system is further configured to be synchronized to the light source. The light source is configured to improve the signal-to-noise ratio of the output signal by increasing light intensity relative to an initial light intensity from at least one of the plurality of LEDs and by increasing pulse rate relative to an initial pulse rate of at least one of the plurality of LEDs. The detection system includes a plurality of spatially separated detectors, wherein at least one analog to digital converter is coupled to the spatially separated detectors and is configured to generate at least two data signals, and the device is configured to further improve the signal-to-noise ratio by differencing the two data signals. The detection system may further include one or more spectral filters positioned in front of at least some of the plurality of spatially separated detectors.
In another embodiment, a wearable device for measuring one or more physiological parameters includes a light source comprising a plurality of semiconductor sources that are light emitting diodes, each of the LEDs configured to generate an output optical beam having one or more optical wavelengths, wherein at least a portion of the one or more optical wavelengths is a near-infrared wavelength between 700 nanometers and 2500 nanometers. A lens is configured to receive a portion of at least one of the output optical beams and to deliver a lens output beam to tissue. A detection system is configured to receive at least a portion of the lens output beam reflected from the tissue and to generate an output signal having a signal-to-noise ratio, wherein the detection system is configured to be synchronized to the light source. The wearable device is configured to increase the signal-to-noise ratio by increasing light intensity of at least one of the plurality of semiconductor sources from an initial light intensity and by increasing a pulse rate from an initial pulse rate of at least one of the plurality of semiconductor sources. The detection system is further configured to capture light while the LEDs are off and convert the captured light into a first signal, capture light while at least one of the LEDs is on and convert the captured light into a second signal, and to increase the signal-to-noise ratio by differencing the first signal and the second signal.
In one embodiment, a device includes a light source comprising a plurality of semiconductor sources that are light emitting diodes, each of the LEDs configured to generate an output optical beam having one or more optical wavelengths, wherein at least a portion of the one or more optical wavelengths is a near-infrared wavelength between 700 nanometers and 2500 nanometers. A lens is configured to receive a portion of at least one of the output optical beams and to deliver a lens output beam to tissue. A reflective surface is configured to receive and redirect at least a portion of light reflected from the tissue. A detection system is configured to receive at least a portion of the lens output beam reflected from the tissue and to generate an output signal having a signal-to-noise ratio, wherein the detection system is configured to be synchronized to the light source. The device is configured to improve the signal-to-noise ratio by increasing light intensity from at least one of the LEDs relative to an initial light intensity and by increasing a pulse rate of at least one of he LEDs relative to an initial pulse rate. The detection system is further configured to: capture light while the LEDs are off and convert the captured light into a first signal, capture light while at least one of the LEDs is on and convert the captured light into a second signal, and further increase the signal-to-noise ratio by differencing the first signal and the second signal.
In one embodiment, a measurement system includes a light source configured to generate an output optical beam comprising one or more semiconductor sources configured to generate an input beam, one or more optical amplifiers configured to receive at least a portion of the input beam and to deliver an intermediate beam to an output end of the one or more optical amplifiers, and one or more optical fibers configured to receive at least a portion of the intermediate beam and to deliver at least the portion of the intermediate beam to a distal end of the one or more optical fibers to form a first optical beam. A nonlinear element is configured to receive at least a portion of the first optical beam and to broaden a spectrum associated with the at least a portion of the first optical beam to at least 10 nm through a nonlinear effect in the nonlinear element to form the output optical beam with an output beam broadened spectrum, wherein at least a portion of the output beam broadened spectrum comprises a short-wave infrared wavelength between approximately 1400 nanometers and approximately 2500 nanometers, and wherein at least a portion of the one or more fibers is a fused silica fiber with a core diameter less than approximately 400 microns. A measurement apparatus is configured to receive a received portion of the output optical beam and to deliver a delivered portion of the output optical beam to a sample for a non-destructive and non-contact measurement, wherein the delivered portion of the output optical beam is configured to generate a spectroscopy output beam from the sample. A receiver is configured to receive at least a portion of the spectroscopy output beam having a bandwidth of at least 10 nanometers and to process the portion of the spectroscopy output beam to generate an output signal, and wherein at least a part of the delivered portion of the output optical beam is at least partially transmitting through a packaging material covering at least a part of the sample, and wherein the output signal is based on a chemical composition of the sample. The receiver usually comprises one or more detectors (optical-to-electrical conversion element) and electrical circuitry. The receiver may also be coupled to analog to digital converters, particularly if the signal is to be fed to a digital device.
In another embodiment, a measurement system includes a light source configured to generate an output optical beam comprising a plurality of semiconductor sources configured to generate an input optical beam, a multiplexer configured to receive at least a portion of the input optical beam and to form an intermediate optical beam, and one or more fibers configured to receive at least a portion of the intermediate optical beam and to form the output optical beam, wherein the output optical beam comprises one or more optical wavelengths. A measurement apparatus is configured to receive a received portion of the output optical beam and to deliver a delivered portion of the output optical beam to a sample, wherein the delivered portion of the output optical beam is configured to generate a spectroscopy output beam from the sample. A receiver is configured to receive at least a portion of the spectroscopy output beam and to process the portion of the spectroscopy output beam to generate an output signal, wherein the receiver comprises a Fourier transform infrared (FTIR) spectrometer or a dispersive spectrometer, and wherein at least a part of the delivered portion of the output optical beam is at least partially transmitting through a packaging material covering at least a part of the sample.
In yet another embodiment, a method of measuring includes generating an output optical beam comprising generating an input optical beam from a plurality of semiconductor sources, multiplexing at least a portion of the input optical beam and forming an intermediate optical beam, and guiding at least a portion of the intermediate optical beam and forming the output optical beam, wherein the output optical beam comprises one or more optical wavelengths. The method may also include receiving a received portion of the output optical beam and delivering a delivered portion of the output optical beam to a sample, wherein the sample comprises an organic compound with an overtone or combinational absorption band in the wavelength range between approximately 1 micron and approximately 2.5 microns. The method may further include generating a spectroscopy output beam having a bandwidth of at least 10 nanometers from the sample using a Fourier transform infrared (FTIR) spectrometer or a dispersive spectrometer, receiving at least a portion of the spectroscopy output beam, and processing the portion of the spectroscopy output beam and generating an output signal.
With the growing obesity epidemic, the number of individuals with diabetes is increasing dramatically. For example, there are over 200 million people who have diabetes. Diabetes control requires monitoring of the glucose level, and most glucose measuring systems available commercially require drawing of blood. Depending on the severity of the diabetes, a patient may have to draw blood and measure glucose four to six times a day. This may be extremely painful and inconvenient for many people. In addition, for some groups, such as soldiers in the battlefield, it may be dangerous to have to measure periodically their glucose level with finger pricks.
Thus, there is an unmet need for non-invasive glucose monitoring (e.g., monitoring glucose without drawing blood). The challenge has been that a non-invasive system requires adequate sensitivity and selectivity, along with repeatability of the results. Yet, this is a very large market, with an estimated annual market of over $10 B in 2011 for self-monitoring of glucose levels.
One approach to non-invasive monitoring of blood constituents or blood analytes is to use near-infrared spectroscopy, such as absorption spectroscopy or near-infrared diffuse reflection or transmission spectroscopy. Some attempts have been made to use broadband light sources, such as tungsten lamps, to perform the spectroscopy. However, several challenges have arisen in these efforts. First, many other constituents in the blood also have signatures in the near-infrared, so spectroscopy and pattern matching, often called spectral fingerprinting, is required to distinguish the glucose with sufficient confidence. Second, the non-invasive procedures have often transmitted or reflected light through the skin, but skin has many spectral artifacts in the near-infrared that may mask the glucose signatures. Moreover, the skin may have significant water and blood content. These difficulties become particularly complicated when a weak light source is used, such as a lamp. More light intensity can help to increase the signal levels, and, hence, the signal-to-noise ratio.
As described in this disclosure, by using brighter light sources, such as fiber-based supercontinuum lasers, super-luminescent laser diodes, light-emitting diodes or a number of laser diodes, the near-infrared signal level from blood constituents may be increased. By shining light through the teeth, which have fewer spectral artifacts than skin in the near-infrared, the blood constituents may be measured with less interfering artifacts. Also, by using pattern matching in spectral fingerprinting and various software techniques, the signatures from different constituents in the blood may be identified. Moreover, value-add services may be provided by wirelessly communicating the monitored data to a handheld device such as a smart phone, and then wirelessly communicating the processed data to the cloud for storing, processing, and transmitting to several locations.
In various embodiments, a measurement system includes a light source configured to generate an output optical beam that includes one or more semiconductor sources configured to generate an input beam, one or more optical amplifiers configured to receive at least a portion of the input beam and to output an intermediate beam from at least one of the one or more optical amplifiers; and one or more optical fibers configured to receive at least a portion of the intermediate beam and to communicate at least part of the portion of the intermediate beam to a distal end of the one or more optical fibers to form a first optical beam. The light source may also include a nonlinear element configured to receive at least a portion of the first optical beam and to broaden a spectrum associated with the at least a portion of the first optical beam to at least 10 nm through a nonlinear effect in the nonlinear element to form the output optical beam with an output beam broadened spectrum. The at least a portion of the output beam broadened spectrum comprises a near-infrared wavelength between approximately 700 nm and approximately 2500 nm, and at least a portion of the one or more fibers is a fused silica fiber with a core diameter less than approximately 400 microns. The system may also include a measurement apparatus configured to receive a received portion of the output optical beam and to deliver to a sample an analysis output beam, which is a delivered portion of the output optical beam and wherein the delivered portion of the output optical beam is a spatially coherent beam, and a receiver configured to receive and process at least a portion of the analysis output beam reflected or transmitted from the sample having a bandwidth of at least 10 nanometers and to generate an output signal. In addition, a personal device comprising a wireless receiver, a wireless transmitter, a display, a microphone, a speaker, one or more buttons or knobs, a microprocessor and a touch screen may be configured to receive and process at least a portion of the output signal, wherein the personal device is configured to store and display the processed output signal, wherein at least a portion of the processed output signal is configured to be transmitted over a wireless transmission link.
In another embodiment, a measurement system includes a light source comprising a plurality of semiconductor sources configured to generate an output optical beam with one or more optical wavelengths, wherein at least a portion of the one or more optical wavelengths is a near-infrared wavelength between 700 nanometers and 2500 nanometers. A measurement apparatus is configured to receive a received portion of the output optical beam and to deliver to a sample an analysis output beam, which is a delivered portion of the output optical beam; and a receiver is configured to receive and process at least a portion of the analysis output beam reflected or transmitted from the sample and to generate an output signal. The system includes a personal device comprising a wireless receiver, a wireless transmitter, a display, a microphone, a speaker, one or more buttons or knobs, a microprocessor and a touch screen, the personal device configured to receive and process at least a portion of the output signal, wherein the personal device is configured to store and display the processed output signal, and wherein at least a portion of the processed output signal is configured to be transmitted over a wireless transmission link, and a remote device configured to receive over the wireless transmission link a received output status comprising the at least a portion of the processed output signal, to buffer the received output status, to process the received output status to generate processed data and to store the processed data.
Other embodiments may include a measurement system comprising a wearable measurement device for measuring one or more physiological parameters, including a light source comprising a plurality of semiconductor sources configured to generate an output optical beam with one or more optical wavelengths, wherein at least a portion of the one or more optical wavelengths is a near-infrared wavelength between 700 nanometers and 2500 nanometers. The wearable measurement device is configured to receive a received portion of the output optical beam and to deliver to a sample an analysis output beam, which is a delivered portion of the output optical beam. The wearable measurement device further comprises a receiver configured to receive and process at least a portion of the analysis output beam reflected or transmitted from the sample and to generate an output signal. The system also includes a personal device comprising a wireless receiver, a wireless transmitter, a display, a microphone, a speaker, one or more buttons or knobs, a microprocessor and a touch screen, the personal device configured to receive and process at least a portion of the output signal, wherein the personal device is configured to store and display the processed output signal, and wherein at least a portion of the processed output signal is configured to be transmitted over a wireless transmission link and a remote device configured to receive over the wireless transmission link a received output status comprising the at least a portion of the processed output signal, to buffer the received output status, to process the received output status to generate processed data and to store the processed data, and wherein the remote device is capable of storing a history of at least a portion of the received output status over a specified period of time.
BRIEF DESCRIPTION OF THE DRAWINGS
For a more complete understanding of the present disclosure, and for further features and advantages thereof, reference is now made to the following description taken in conjunction with the accompanying drawings, in which:
FIG. 1 shows the absorbance for two common plastics, polyethylene and polystyrene.
FIG. 2 illustrates one example of the difference in near-infrared spectrum between an authentic tablet and a counterfeit tablet.
FIG. 3 shows the second derivative of the spectral comparison of Prozac and a similarly formulated generic.
FIG. 4 illustrates an example of the near infrared spectra for different pure components of a studied drug.
FIG. 5 shows the mid-wave infrared and long-wave infrared absorption spectra for various illicit drugs.
FIG. 6 shows the absorbance versus wavelength in the near-infrared region for four classes of illegal drugs.
FIG. 7 illustrates the diffuse reflectance near-infrared spectrum of heroin samples.
FIG. 8 illustrates the diffuse reflectance near-infrared spectra of different seized illicit drugs containing heroin of different concentrations, along with the spectrum for pure heroin.
FIGS. 9A and 9B list possible band assignments for the various spectral features in pure heroin.
FIG. 10 shows the diffuse reflectance near-infrared spectra of different compounds that may be frequently employed as cutting agents.
FIG. 11 provides one example of a flow-chart in the process analytical technology for the pharmaceutical industry.
FIG. 12 illustrates the typical near-infrared spectra of a variety of excipients.
FIG. 13 exemplifies the absorbance from the blending process of a pharmaceutical compound.
FIG. 14 shows what might be an eventual flow-chart of a smart manufacturing process.
FIG. 15A illustrates the near-infrared reflectance spectrum of wheat flour.
FIG. 15B shows the near-infrared absorbance spectra obtained in diffusion reflectance mode for a series of whole `Hass` avocado fruit.
FIG. 16A is a schematic diagram of the basic elements of an imaging spectrometer.
FIG. 16B illustrates one example of a typical imaging spectrometer used in hyper-spectral imaging systems.
FIG. 17 shows one example of the Fourier transform infrared spectrometer.
FIG. 18A shows one example of a dual-beam experimental set-up that may be used to subtract out (or at least minimize the adverse effects of) light source fluctuations.
FIG. 18B shows the dorsal of the hand, where a differential measurement may be made to at least partially compensate for or subtract out the skin interference.
FIG. 18C shows the dorsal of the foot, where a differential measurement may be made to at least partially compensate for or subtract out the skin interference.
FIG. 19 illustrates a block diagram or building blocks for constructing high power laser diode assemblies.
FIG. 20 shows a platform architecture for different wavelength ranges for an all-fiber-integrated, high powered, super-continuum light source.
FIG. 21 illustrates one embodiment for a short-wave infrared super-continuum light source.
FIG. 22 shows the output spectrum from the SWIR SC laser of FIG. 21 when about a 10 m length of fiber for SC generation is used. This fiber is a single-mode, non-dispersion shifted fiber that is optimized for operation near 1550 nm.
FIG. 23A illustrates a high power SWIR-SC laser that may generate light between approximately 1.4-1.8 microns.
FIG. 23B illustrates a high power SWIR-SC laser that may generate light between approximately 2-2.5 microns.
FIG. 23C shows a reflection-spectroscopy based stand-off detection system having an SC laser source.
FIG. 24 schematically shows a medical measurement device as part of a personal or body area network that communicates with another device (e.g., smart phone or tablet) that communicates with the cloud. The cloud may in turn communicate information with the user, healthcare providers, or other designated recipients.
DETAILED DESCRIPTION
As required, detailed embodiments of the present disclosure are described herein; however, it is to be understood that the disclosed embodiments are merely exemplary of the disclosure that may be embodied in various and alternative forms. The figures are not necessarily to scale; some features may be exaggerated or minimized to show details of particular components. Therefore, specific structural and functional details disclosed herein are not to be interpreted as limiting, but merely as a representative basis for teaching one skilled in the art to variously employ the present disclosure.
One advantage of optical systems is that they can perform non-contact, stand-off or remote sensing distance spectroscopy of various materials. As an example, optical systems can be used for identification of counterfeit drugs, detection of illicit drugs, or process control in the pharmaceutical industry, especially when the sensing is to be done at remote or stand-off distances in a non-contact, rapid manner. In general, the near-infrared region of the electromagnetic spectrum covers between approximately 0.7 microns (700 nm) to about 2.5 microns (2500 nm). However, it may also be advantageous to use just the short-wave infrared (SWIR) between approximately 1.4 microns (1400 nm) and about 2.5 microns (2500 nm). One reason for preferring the SWIR over the entire NIR may be to operate in the so-called "eye safe" window, which corresponds to wavelengths longer than about 1400 nm. Therefore, for the remainder of the disclosure the SWIR will be used for illustrative purposes. However, it should be clear that the discussion that follows could also apply to using the near infrared--NIR--wavelength range, or other wavelength bands.
In particular, wavelengths in the eye safe window may not transmit down to the retina of the eye, and therefore, these wavelengths may be less likely to create permanent eye damage from inadvertent exposure. The near-infrared wavelengths have the potential to be dangerous, because the eye cannot see the wavelengths (as it can in the visible), yet they can penetrate and cause damage to the eye. Even if a practitioner is not looking directly at the laser beam, the practitioner's eyes may receive stray light from a reflection or scattering some surface. Hence, it can always be a good practice to use eye protection when working around lasers. Since wavelengths longer than about 1400 nm are substantially not transmitted to the retina or substantially absorbed in the retina, this wavelength range is known as the eye safe window. For wavelengths longer than 1400 nm, in general only the cornea of the eye may receive or absorb the light radiation.
The SWIR wavelength range may be particularly valuable for identifying materials based on their chemical composition because the wavelength range comprises overtones and combination bands for numerous chemical bonds. For example, in the SWIR numerous hydro-carbon chemical compounds have overtone and combinational bands, along with oxygen-hydrogen and carbon-oxygen compounds. Thus, gases, liquids and solids that comprise these chemical compounds may exhibit spectral features in the SWIR wavelength range. In a particular embodiment, the spectra of organic compounds may be dominated by the C--H stretch. The C--H stretch fundamental occurs near 3.4 microns, the first overtone is near 1.7 microns, and a combination band occurs near 2.3 microns.
One embodiment of remote sensing that is used to identify and classify various materials is so-called "hyper-spectral imaging." Hyper-spectral sensors may collect information as a set of images, where each image represents a range of wavelengths over a spectral band. Hyper-spectral imaging may deal with imaging narrow spectral bands over an approximately continuous spectral range. As an example, in hyper-spectral imaging a lamp may be used as the light source. However, the incoherent light from a lamp may spatially diffract rapidly, thereby making it difficult to perform spectroscopy at stand-off distances or remote distances. Therefore, it would be advantageous to have a broadband light source covering the SWIR that may be used in place of a lamp to identify or classify materials in remote sensing or stand-off detection applications.
As used throughout this document, the term "couple" and or "coupled" refers to any direct or indirect communication between two or more elements, whether or not those elements are physically connected to one another. As used throughout this disclosure, the term "spectroscopy" means that a tissue or sample is inspected by comparing different features, such as wavelength (or frequency), spatial location, transmission, absorption, reflectivity, scattering, fluorescence, refractive index, or opacity. In one embodiment, "spectroscopy" may mean that the wavelength of the light source is varied, and the transmission, absorption, fluorescence, or reflectivity of the tissue or sample is measured as a function of wavelength. In another embodiment, "spectroscopy" may mean that the wavelength dependence of the transmission, absorption, fluorescence or reflectivity is compared between different spatial locations on a tissue or sample. As an illustration, the "spectroscopy" may be performed by varying the wavelength of the light source, or by using a broadband light source and analyzing the signal using a spectrometer, wavemeter, or optical spectrum analyzer.
As used throughout this document, the term "fiber laser" refers to a laser or oscillator that has as an output light or an optical beam, wherein at least a part of the laser comprises an optical fiber. For instance, the fiber in the "fiber laser" may comprise one of or a combination of a single mode fiber, a multi-mode fiber, a mid-infrared fiber, a photonic crystal fiber, a doped fiber, a gain fiber, or, more generally, an approximately cylindrically shaped waveguide or light-pipe. In one embodiment, the gain fiber may be doped with rare earth material, such as ytterbium, erbium, and/or thulium. In another embodiment, the mid-infrared fiber may comprise one or a combination of fluoride fiber, ZBLAN fiber, chalcogenide fiber, tellurite fiber, or germanium doped fiber. In yet another embodiment, the single mode fiber may include standard single-mode fiber, dispersion shifted fiber, non-zero dispersion shifted fiber, high-nonlinearity fiber, and small core size fibers.
As used throughout this disclosure, the term "pump laser" refers to a laser or oscillator that has as an output light or an optical beam, wherein the output light or optical beam is coupled to a gain medium to excite the gain medium, which in turn may amplify another input optical signal or beam. In one particular example, the gain medium may be a doped fiber, such as a fiber doped with ytterbium, erbium and/or thulium. In one embodiment, the "pump laser" may be a fiber laser, a solid state laser, a laser involving a nonlinear crystal, an optical parametric oscillator, a semiconductor laser, or a plurality of semiconductor lasers that may be multiplexed together. In another embodiment, the "pump laser" may be coupled to the gain medium by using a fiber coupler, a dichroic mirror, a multiplexer, a wavelength division multiplexer, a grating, or a fused fiber coupler.
As used throughout this document, the term "super-continuum" and or "supercontinuum" and or "SC" refers to a broadband light beam or output that comprises a plurality of wavelengths. In a particular example, the plurality of wavelengths may be adjacent to one-another, so that the spectrum of the light beam or output appears as a continuous band when measured with a spectrometer. In one embodiment, the broadband light beam may have a bandwidth of at least 10 nm. In another embodiment, the "super-continuum" may be generated through nonlinear optical interactions in a medium, such as an optical fiber or nonlinear crystal. For example, the "super-continuum" may be generated through one or a combination of nonlinear activities such as four-wave mixing, parametric amplification, the Raman effect, modulational instability, and self-phase modulation.
As used throughout this disclosure, the terms "optical light" and or "optical beam" and or "light beam" refer to photons or light transmitted to a particular location in space. The "optical light" and or "optical beam" and or "light beam" may be modulated or unmodulated, which also means that they may or may not contain information. In one embodiment, the "optical light" and or "optical beam" and or "light beam" may originate from a fiber, a fiber laser, a laser, a light emitting diode, a lamp, a pump laser, or a light source.
As used throughout this disclosure, the term "remote sensing" may include the measuring of properties of an object from a distance, without physically sampling the object, for example by detection of the interactions of the object with an electromagnetic field. In one embodiment, the electromagnetic field may be in the optical wavelength range, including the infrared or SWIR. One particular form of remote sensing may be stand-off detection, which may range exemplary from non-contact up to hundreds of meters away.
Identification of Counterfeit Drugs
Pharmaceutical counterfeiting is a growing and significant issue for the healthcare community as well as the pharmaceutical industry worldwide. As a result of counterfeiting, users may be threatened by substandard drug quality or harmful ingredients, and legitimate companies may lose significant revenues. The definition for "counterfeit drug" by the World Health Organization was as follows: "A counterfeit medicine is one which is deliberately and fraudulently mislabeled with respect to identity and/or source. Counterfeiting can apply to both branded and generic products and counterfeit products may include products with the correct ingredients or with the wrong ingredients, without active ingredients, with insufficient active ingredient or with fake packaging." Later this definition was slightly modified, "Counterfeiting in relation to medicinal products means the deliberate and fraudulent mislabeling with respect to the identity, composition and/or source of a finished medicinal product, or ingredient for the preparation of a medicinal product."
A rapid screening technique such as near-infrared or SWIR spectroscopy could aid in the search for and identification of counterfeit drugs. In particular, using a non-lamp based light source could lead to contact-free control and analysis of drugs. In a particular embodiment, remote sensing, stand-off detection, or hyper-spectral imaging may be used for process control or counterfeit drug identification in a factory or manufacturing setting, or in a retail, wholesale, or warehouse setting. In one embodiment, the light source for remote sensing may direct the light beam toward the region of interest (e.g., conveyor belt, stocking shelves, boxes or cartons, etc), and the diffuse reflected light may then be measured using a detection system. Various kinds of SWIR light sources will be discussed later in this disclosure. The detection system may comprise, in one embodiment, a spectrometer followed by one or more detectors. In another embodiment, the detection system may be a dispersive element (examples include prisms, gratings, or other wavelength separators) followed by one or more detectors or detector arrays. In yet another embodiment, the detection system may comprise a Fourier transform infrared spectrometer. The receiver usually comprises one or more detectors (optical-to-electrical conversion element) and electrical circuitry. The receiver may also be coupled to analog to digital converters, particularly if the signal is to be fed to a digital device. These are merely specific examples of the detection system, but combinations of these or other detection systems may also be used and are contemplated within the scope of this disclosure.
For monitoring drugs, the SWIR light source and the detection system could be used in transmission, reflection, fluorescence, or diffuse reflection. Also, different system configurations may also be used and are included in the scope of this disclosure. For example, the light source and detection system may be placed in a fixed location, and for reflection the light source and detectors may be close to one another, while for transmission the light source and detectors may be at different locations. The region of interest may be surveyed, and the light beam may also be scanned to cover an area larger than the light source beam. In yet another embodiment, the system could be placed on a vehicle such as an automobile or a truck, or the light source could be placed on one vehicle, while the detection system is on another vehicle. If the light source and detection system are compact and lightweight, they might even be carried by a person in the field, either in their hands or in a backpack.
Another advantage of using the near-infrared or SWIR is that most drug packaging materials are at least partially transparent in this wavelength range, so that drug compositions may be detected and identified through the packaging non-destructively. As an example, SWIR light could be used to see through plastics, since the signature for plastics can be subtracted off and there are large wavelength windows where the plastics are transparent. FIG. 1 illustrates the absorbance 100 for two common plastics: polyethylene 101 and polystyrene 102. Because of the hydro-carbon bonds, there are absorption features near 1.7 microns and 2.2-2.5 microns. In general, the absorption bands in the near infrared are due to overtones and combination bands for various functional group vibrations, including signals from C--H, O--H, C.dbd.O, N--H, --COOH, and aromatic C--H groups. It may be difficult to assign an absorption band to a specific functional group due to overlapping of several combinations and overtones. However, with advancements in computational power and chemometrics or multivariate analysis methods, complex systems may be better analyzed. In one embodiment, using software analysis tools the absorption spectrum may be converted to its second derivative equivalent. The spectral differences may permit a fast, accurate, non-destructive and reliable identification of materials. Although particular derivatives are discussed, other mathematical manipulations may be used in the analysis, and these other techniques are also intended to be covered by this disclosure.
Spectroscopy in the near-infrared or SWIR may be sensitive to both the chemical and physical nature of the sample composition and may be performed rapidly with minimal sample preparation. For example, near-infrared or SWIR spectroscopy may be used to study the homogeneity of powder samples, particle size determinations, product composition, the determination of the concentrations and distribution of components in solid tablets and content uniformity, among other applications. In yet other embodiments, applications include tablet identification, determination of moisture, residual solvents, active ingredient potency, the study of blending operations, and the detection of capsule tampering.
FIG. 2 illustrates one example of the difference in near-infrared spectrum 200 between an authentic tablet and a counterfeit tablet. Two grades of film coated tablets comprising drugs were investigated: curve 201 is the genuine drug, while 202 is a counterfeit drug. These two grades of capsules have noticeably different contents, and the differences are apparent in the near-infrared or SWIR spectra. In some cases the differences may not be as distinct. For these cases, more signal processing may be necessary to distinguish between samples.
In another embodiment, it may be advantageous to take a first, second or higher order derivative to elucidate the difference between real and counterfeit drugs. For example, FIG. 3 shows the second derivative 300 of the spectral comparison of Prozac 301 and a similarly formulated generic 302, which had a fluoxetine hydrochloride (10 mg). Although the reflectance curves from the two samples are close and, therefore, difficult to distinguish, the second derivative of the data helps to bring out the differences more clearly. Although a second derivative is used in this example, any number of signal processing algorithms and methods may be used, and these are also intended to be covered by this disclosure. For example, partial least square algorithms, multivariate data analysis, principal component analysis, or chemometric software may be implemented without departing from the scope of this disclosure.
In yet another embodiment, near-infrared or SWIR spectroscopy may be used to measure and calibrate various pharmaceutical formulations based on the active pharmaceutical ingredients and excipients. An excipient may be a pharmacologically inactive substance used as a carrier for the active ingredients of a medication. In some cases, the active substance may not be easily administered and/or absorbed by the human body; in such cases the active ingredient may be dissolved into or mixed with an excipient. Also, excipients are also sometimes used to bulk up formulations that contain very potent active ingredients, to allow for convenient and accurate dosage. In addition to their use in the single-dosage quantity, excipients can be used in the manufacturing process to aid in the handling of the active substance concerned.
FIG. 4 shows an example of the near-infrared spectra 400 for different pure components of a studied drug. The spectrum for the active pharmaceutical ingredient (API) 401 is plotted, along with the spectra for five different excipients 402, 403, 404, 405 and 406. Each spectrum has been baseline shifted to avoid overlapping. The near-infrared spectra have been obtained by averaging the spectra of each pixel of an area of a hyper-spectral image. As FIG. 4 shows, each of the chemical compositions have a distinct spectrum, and the composition of a drug may be decomposed into its constitutive ingredients. These are just some examples of how near-infrared or SWIR spectroscopy may be applied to counterfeit drug detection, but other methods and analysis techniques may also be used without departing from the scope of this disclosure. As one other example, once the active pharmaceutical ingredient and the excipients spectral distribution of a drug formulation are understood, feedback may be provided of this information to the drug development stages.
Rapid Screening for Illicit Drugs
Thus, FIGS. 2-4 show that near-infrared or SWIR spectroscopy may be used to identify counterfeit drugs. More generally, various materials including illicit drugs, explosives, fertilizers, vegetation, and paints have features in the near-infrared and SWIR that can be used to identify the various samples, and these applications are also intended to be within the scope of this disclosure. Although stronger features may be found in the mid-infrared, the near-infrared may be easier to measure due to higher quality detection systems, more mature fiber optics and light sources, and transmission through atmospheric transmission windows. Because of these distinct spectral signatures, these materials could also be detected using active remote sensing, hyper-spectral imaging, or near-infrared or SWIR spectroscopy. As just another example, illicit drugs may be detectable using remote sensing, hyper-spectral imaging, or near-infrared spectroscopy. FIG. 5 shows the mid-wave infrared and long-wave infrared absorption spectra 500 for various illicit drugs. The absorbance for cocaine 501, methamphetamine 502, MDMA (ecstasy) 503, and heroin 504 are plotted versus wavelength from approximately 2.5-20 microns. Although the fundamental resonances for these drugs may lie in the longer wavelength regions, there are corresponding overtones and combination bands in the SWIR and near-infrared wavelength range. Therefore, the active remote sensing, hyper-spectral imaging, or near-infrared or SWIR spectroscopy techniques described herein may also be applicable to detecting illicit drugs from aircraft, vehicles, or hand held devices.
The diffuse reflectance technique may be useful with near-infrared or SWIR spectroscopy for rapid identification of illegal drugs due to simple handling and simple use of a search data library created using near-infrared diffuse reflectance. For instance, FIG. 6 illustrates the absorbance 600 versus wavelength in the near-infrared region for four classes of illegal drugs. In particular, the spectra are shown for methamphetamine (MA) 601, amphetamine (AP) 602, MDMA (street name: ecstasy) 603, and MDA (street name: the love drug) 604. Each of the illegal drugs have unique spectral features in the near-infrared and SWIR. Also, comparing the mid-infrared spectrum for MDMA (503 in FIG. 5) with the near-infrared spectrum for MDMA (603 in FIG. 6), it seems clear that the near-infrared region shows overtones and combination bands that should be discernible. Referring to FIG. 6, sample identification may be accomplished by using the region (indicated by the arrows) where the spectral absorptions may provide specific peaks depending on the drug component.
In another embodiment, FIG. 7 shows the diffuse reflectance near-infrared spectrum 700 of heroin samples. Heroin, the 3,6-diacetyl derivative of morphine (hence diacetyl-morphine) is an opiate drug synthesized from morphine, which is usually a naturally occurring substance extracted from the seedpod of certain varieties of poppy plants. In particular, 701 is the near-infrared spectrum for an illicit street drug sample, while 702 is the spectra for a pure heroin standard. The difference between the spectra may arise at least in part from cutting agents. The inset 703 shows the molecular structure for heroin. As in the other examples, the absorption in the near-infrared range is caused by overtone and combination vibrations of O--H, C--H, N--H and C.dbd.O groups, which exhibit their fundamental molecular stretching and bending absorption in the mid-infrared range (c.f., the mid-infrared spectrum for heroin is shown 504 in FIG. 5). These overtone and combination bands do not behave in a simple way, making the near-infrared spectra complex and harder to directly interpret. Also, although the near-infrared signatures may be weaker in magnitude, they are probably easier to detect in the near-infrared, and the sample preparation may also be much simpler in the near-infrared. Moreover, for remote sensing, the near-infrared may be preferable because of atmospheric transmission windows between approximately 1.4-1.8 microns and 2-2.5 microns.
Pure heroin may be a white powder with a bitter taste that is rarely sold on the streets, while illicit heroin may be a powder varying in color from white to dark brown due to impurities left from the manufacturing process or the presence of additives. The purity of street heroin may also vary widely, as the drug can be mixed with other white powders. The impurity of the drug may often make it difficult to gauge the strength of the dosage, which runs the risk of overdose. One nice feature of near-infrared or SWIR spectroscopy is that the technique may be used in a non-destructive, non-contact manner to determine rapidly the concentration of compounds present in complex samples at percentage levels with very little sample preparation. In a particular embodiment, FIG. 8 illustrates the diffuse reflectance near-infrared spectra 800 of different seized illicit drugs containing heroin (between 10.7 and 21.8%) compared with the spectrum of pure heroin 801. Curve 802 is for 21.8% by weight, curve 803 is 13.2% by weight, curve 804 is 17% by weight, and curve 805 is 10.7% by weight of heroin. The spectra have been shifted along the vertical axis to better illustrate the differences.
Although quite complex in the near-infrared, it may be possible to identify from the pure heroin near-infrared spectrum (801 in FIG. 8 or 702 in FIG. 7) the main wavelengths related to the most common functional groups in heroin. For example, FIG. 9 lists possible band assignments 900 for the various spectral features in pure heroin. As can be seen from FIG. 9, the absorption in the near-infrared may be mainly due to overtone and combination bands associated with O--H, C--H, N--H and C.dbd.O groups.
As can be appreciated from FIG. 8, there may be significant differences between the spectrum of pure heroin and sample spectra. These differences may be due to the presence of different compounds used as cutting agents, which can affect the shape and intensity of the near-infrared signals. FIG. 10 illustrates the diffuse reflectance near-infrared spectra 1000 of different compounds that may be frequently employed as cutting agents. In the bottom of FIG. 10 are shown the spectra 1008 for pure heroin and the spectra 1007 for a seized illicit street drug sample comprising 21.8% of heroin. The spectra for various cutting agents include: 1001 for flour, 1002 for talcum powder, 1003 for chalk, 1004 for acetylsalicylic acid, 1005 for caffeine, and 1006 for paracetamol. Thus, near-infrared or SWIR spectroscopy may be used to work back to the composition of an unknown drug. Although particular examples of counterfeit and illicit drugs have been described, the near-infrared or SWIR spectroscopy (including diffuse reflectance, reflectance, fluorescence or transmission) may also be applied to the identification of other drugs and substances without departing from the scope of this disclosure. This spectroscopy may be used non-destructively and non-contact over stand-off distances or in remote sensing distances, whether from an airborne, vehicle, hand-held, or stationary platform.
Process Analytical Technology (PAT)
One definition of process analytical technology, PAT, is "a system for designing, analyzing and controlling manufacturing through timely evaluations (i.e., during processing) of significant quality and performance attributes of raw and in-process materials and processes, with the goal of ensuring final product quality." Near-infrared or SWIR spectroscopy may have applications in the PAT of the pharmaceutical industry by providing, for example, quantitative analysis of multiple components in a sample and in pack quantification of drugs in formulation, as well as quality of a drug and quality control of complex excipients used in formulation. The PAT process may benefit from near-infrared or SWIR spectroscopy for some steps, such as: raw material identification, active pharmaceutical ingredient applications, drying, granulation, blend uniformity and content uniformity. Some of the strengths of near-infrared or SWIR spectroscopy include: radiation has good penetration properties, and, thus, minimal sample preparation may be required; measurement results may be obtained rapidly, and simultaneous measurements may be obtained for several parameters; non-destructive methods with little or no chemical waste; and organic chemicals that comprise most pharmaceutical products have unique spectra in the near-infrared and SWIR ranges, for example.
FIG. 11 shows one example of a flow-chart 1100 in the PAT for the pharmaceutical industry. While the center shows the steps of the manufacturing process 1101, the top and bottom sides show where near-infrared spectroscopy could be applicable for lab use 1102 (top) or in process monitoring control 1103 (bottom). Indeed, near-infrared or SWIR spectroscopy has the potential to benefit almost every step in the manufacturing process. Just to provide a few examples of using near-infrared or SWIR spectroscopy in the PAT process, the raw material testing and blending process will be examined briefly.
At the commencement of manufacture of a drug product, it may be required to identify the correct material and grade of the pharmaceutical excipients to be used in the formulation. FIG. 12 illustrates the typical near-infrared spectra 1200 for a variety of excipients. Included in the graph 1200 are spectra for: magnesium stearate 1201, sorbitol 1202, mannitol 1203, talc 1204, lactose 1205, starch 1206, maltodextrin 1207, and microcrystalline cellulose 1208. A suitable spectral database may be used to rapidly identify and qualify excipients. One nice aspect of the spectroscopy is that the near-infrared and SWIR are sensitive to both the physical and chemical characteristics of the samples.
One of the next steps in the manufacture of a dosage form is the blending together of the active component with the excipients to produce a homogeneous blend. In one embodiment, the near-infrared or SWIR spectroscopy apparatus may comprise a fiber-optic probe, which may, for example, interface with the blending vessel. For such a fiber-optic probe, near infrared or SWIR spectra may be collected in real-time from a blending process. FIG. 13 exemplifies the absorbance 1300 from the blending process. Although the initial spectra 1301 shows differences from the eventual spectra, as the process continues the blend converges to the final spectra 1302 and continues to overlap that spectra. Similar converging or overlapping spectra may also be used to check the product uniformity at the end of the process. The near-infrared spectra may be acquired in real-time; and, using appropriate data pre-processing and chemometric analysis, blend homogeneity plots may be derived, such as 1300.
One goal of the manufacturing process and PAT may be the concept of a "smart" manufacturing process, which may be a system or manufacturing operation responding to analytical data generated in real-time. Such a system may also have an in-built "artificial intelligence" as decisions may be made whether to continue a manufacturing operation. For example, with respect to the raw materials, integration of the quality measurement into smart manufacturing processes could be used to improve manufacturing operations by ensuring that the correct materials of the appropriate quality are used in the manufacture. Similarly, a smart blender would be under software control and would respond to the real-time spectral data collected.
FIG. 14 illustrates what might be an eventual flow-chart 1400 of a smart manufacturing process. The manufacturing process 1401 may have as input the process feed 1402 and result in a process output 1403. A process controller 1404 may at least partially control the manufacturing process 1401, and the controller 1404 may receive inputs from the closed loop control (process parameters) 1405 as well as the on-line monitoring of process parameters 1406. The feedback loops in the process could refine the manufacturing process 1401 and improve the quality of the process output 1403. These are particular embodiments of the use of near-infrared or SWIR spectroscopy in the PAT of the pharmaceutical industry, but other variations, combinations, and methods may also be used and are intended to be covered by this disclosure.
The discussion thus far has centered on use of near-infrared or SWIR spectroscopy in applications such as identification of counterfeit drugs, detection of illicit drugs, and pharmaceutical process control. Although drugs and pharmaceuticals are one example, many other fields and applications may also benefit from the use of near infrared or SWIR spectroscopy, and these may also be implemented without departing from the scope of this disclosure. As just another example, near-infrared or SWIR spectroscopy may also be used as an analytic tool for food quality and safety control. Applications in food safety and quality assessment include contaminant detection, defect identification, constituent analysis, and quality evaluation. The techniques described in this disclosure are particularly valuable when non-destructive testing is desired at stand-off or remote distances.
In one example, near-infrared or SWIR spectroscopy may be used in cereal breeding. The breeding purposes may require knowledge on both composition and functional properties of grain, while the functionality of wheat grain is an issue for wheat breeders. Most of the wheat functionality parameters depend on the protein-proteinase complex of wheat grain, as well as the condition of the carbohydrate complex. FIG. 15A illustrates the near-infrared reflectance spectrum 1500 of wheat flour. Since these samples are complex in composition, several organic bonds involving hydrogen vibrate to produce overlapped spectral bands. Thus, the resulting spectrum 1500 appears like a wavy line without clearly defined features. Analytical methods based on this type of spectroscopy may have the potential to improve the quality of final cereal products by testing the products through the entire production process in the processing industry.
In yet another embodiment, near-infrared or SWIR spectroscopy may be used for the assessment of fruit and vegetable quality. Most commercial quality classification systems for fruit and vegetables are based on external features of the product, such as shape, color, size, weight and blemishes. However, the external appearance of most fruit is generally not an accurate guide to the internal eating quality of the fruit. As an example, for avocado fruit the external color is not a maturity characteristic, and its smell is too weak and appears later in its maturity stage. Analysis of the near-infrared or SWIR absorption spectra may provide qualitative and quantitative determination of many constituents and properties of horticulture produce, including oil, water, protein, pH, acidity, firmness, and soluble solids content or total soluble solids of fresh fruits. FIG. 15B shows the near-infrared absorbance spectra 1550 obtained in diffusion reflectance mode for a series of whole `Hass` avocado fruit. Four oil absorption bands are near 2200-2400 nm (CH.sub.2 stretch bend and combinations), with weaker absorption around 750 nm, 1200 nm, and 900-930 nm ranges. On the other hand, near 1300-1750 nm range may be useful for determining the protein and oil content. The 900-920 nm absorbance band may be useful for sugar determination. Although described in the context of grains, fruits, and vegetables, the near-infrared or SWIR spectroscopy may also be valuable for other food quality control and assessment, such as measuring the properties of meats. These and other applications also fall within the scope of this disclosure.
Detection Systems
The near-infrared or SWIR spectroscopy system, remote sensing system or hyper-spectral imaging system may be on an airborne platform, mounted on a vehicle, a stationary transmission or reflection set-up, or even held by a human for a compact system. For such a system, there are fundamentally two hardware parts: the transmitter or light source and the detection system. Between the two, perhaps in a transmission or reflection setting, may be the sample being tested or measured. Moreover, the output from the detection system may go to a computational system, comprising computers or other processing equipment. The output from the computational system may be displayed graphically as well as with numerical tables and perhaps an identification of the material composition. These are just some of the parts of the systems, but other elements may be added or be eliminated, and these modified configurations are also intended to be covered by this disclosure.
By use of an active illuminator, a number of advantages may be achieved. First, stand-off or remote distances may be achieved if a non-lamp system is used--i.e., if the beam does not rapidly diffract. Also, higher signal-to-noise ratios may be achieved. For example, one way to improve the signal-to-noise ratio would be to use modulation and lock-in techniques. In one embodiment, the light source may be modulated, and then the detection system would be synchronized with the light source. In a particular embodiment, the techniques from lock-in detection may be used, where narrow band filtering around the modulation frequency may be used to reject noise outside the modulation frequency. In another embodiment, change detection schemes may be used, where the detection system captures the signal with the light source on and with the light source off. Again, for this system the light source may be modulated. Then, the signal with and without the light source is differenced. Change detection may help to identify objects that change in the field of view. In the following some exemplary detection systems are described.
In one embodiment, a SWIR camera or infrared camera system may be used to capture the images. The camera may include one or more lenses on the input, which may be adjustable. The focal plane assemblies may be made from mercury cadmium telluride material (HgCdTe), and the detectors may also include thermo-electric coolers. Alternately, the image sensors may be made from indium gallium arsenide (InGaAs), and CMOS transistors may be connected to each pixel of the InGaAs photodiode array. The camera may interface wirelessly or with a cable (e.g., USB, Ethernet cable, or fiber optics cable) to a computer or tablet or smart phone, where the images may be captured and processed. These are a few examples of infrared cameras, but other SWIR or infrared cameras may be used and are intended to be covered by this disclosure.
In another embodiment, an imaging spectrometer may be used to detect the light received from the sample. For example, FIG. 16A shows a schematic diagram 1600 of the basic elements of an imaging spectrometer. The input light 1601 from the sample may first be directed by a scanning mirror and/or other optics 1602. An optical dispersing element 1603, such as a grating or prism, in the spectrometer may split the light into many narrow, adjacent wavelength bands, which may then be passed through imaging optics 1604 onto one or more detectors or detector arrays 1605. Some sensors may use multiple detector arrays to measure hundreds of narrow wavelength bands.
An example of a typical imaging spectrometer 1650 used in hyper-spectral imaging systems is illustrated in FIG. 16B. In this particular embodiment, the input light may be directed first by a tunable mirror 1651. A front lens 1652 may be placed before the entrance slit 1653 and the collector lens 1654. In this embodiment, the dispersing element is a holographic grating with a prism 1655, which separates the different wavelength bands. Then, a camera lens 1656 may be used to image the wavelengths onto a detector or camera 1657.
FIGS. 16A and 16B provide particular examples, but some of the elements may not be used, or other elements may be added, and these are also intended to be covered by this disclosure. For instance, a scanning spectrometer may be used before the detector, where a grating or dispersive element is scanned to vary the wavelength being measured by the detector. The receiver usually comprises one or more detectors (optical-to-electrical conversion element) and electrical circuitry. The receiver may also be coupled to analog to digital converters, particularly if the signal is to be fed to a digital device. In yet another embodiment, filters may be used before one or more detectors to select the wavelengths or wavelength bands to be measured. This may be particularly useful if only a few bands or wavelengths are to be measured. The filters may be dielectric filters, Fabry-Perot filters, absorption or reflection filters, fiber gratings, or any other wavelength selective filter. In one embodiment, a wavelength division multiplexer, WDM, may be used followed by one or more detectors or detector arrays. One example of a planar wavelength division multiplexer may be a waveguide grating router or an arrayed waveguide grating. The WDM may be fiber coupled, and detectors may be placed directly at the output or the detectors may be coupled through fibers to the WDM. Some of these components may also be combined with the configurations in FIGS. 16A and 16B.
While the above detection systems could be categorized as single path detection systems, it may be advantageous in some cases to use multi-path detection systems. In one embodiment, a detection system from a Fourier transform infrared spectrometer, FTIR, may be used. The received light may be incident on a particular configuration of mirrors, called a Michelson interferometer, that allows some wavelengths to pass through but blocks others due to wave interference. The beam may be modified for each new data point by moving one of the mirrors, which changes the set of wavelengths that pass through. This collected data is called an interferogram. The interferogram is then processed, typically on a computing system, using an algorithm called the Fourier transform. One advantageous feature of FTIR is that it may simultaneously collect spectral data in a wide spectral range.
FIG. 17 illustrates one example of the FTIR spectrometer 1700. Light from the near-infrared or SWIR light source 1701 may be collimated and directed to a beam splitter 1702. In one embodiment, the beam splitter 1702 may be a 50:50 beam splitter. One portion of the beam 1703 may be reflected toward a stationary mirror 1704, while the other portion of the beam 1705 may be transmitted towards a moving mirror 1706. Light may be reflected from the two mirrors 1704, 1706 back to the beam splitter 1702, and then a portion of the recombined beam 1707 may be directed toward the sample 1708. The recombined beam 1707 may be focused onto the sample 1708, in one embodiment. On leaving the sample 1708, the light may be refocused or at least collected at a detector 1709. A background interferogram may be obtained by using the set-up 1700 without a sample in the chamber 1708. When a sample is inserted into 1708, the background interferogram may be modulated by the presence of absorption bands in the sample. The FTIR spectrometer may have several advantages compared to a scanning (dispersive) spectrometer. Since all the wavelengths may be collected simultaneously, the FTIR may result in a higher signal-to-noise ratio for a given scan time or a shorter scan time for a given resolution. Moreover, unlike a spectrometer where a slit may limit the amount of the beam detected, the FTIR may accommodate the entire diameter of the beam coming from the light source 1701. The configuration 1700 is one example of an FTIR, but other configurations may also be used, and these are also intended to be covered by this disclosure.
In yet another example of multi-beam detection systems, a dual-beam set-up 1800 such as in FIG. 18A may be used to subtract out (or at least minimize the adverse effects of) light source fluctuations. In one embodiment, the output from an SC source 1801 may be collimated using a CaF.sub.2 lens 1802 and then focused into the entrance slit of the monochromator 1803. At the exit slit, light at the selected wavelength is collimated again and may be passed through a polarizer 1804 before being incident on a calcium fluoride beam splitter 1805. After passing through the beam splitter 1805, the light is split into a sample 1806 and reference 1807 arm to enable ratiometric detection that may cancel out effects of intensity fluctuations in the SC source 1801. The light in the sample arm 1806 passes through the sample of interest and is then focused onto a HgCdTe detector 1808 connected to a pre-amp. A chopper 1802 and lock-in amplifier 1810 setup enable low noise detection of the sample arm signal. The light in the reference arm 1807 passes through an empty container (cuvette, gas cell etc.) of the same kind as used in the sample arm. A substantially identical detector 1809, pre-amp and lock-in amplifier 1810 is used for detection of the reference arm signal. The signal may then be analyzed using a computer system 1811. This is one particular example of a method to remove fluctuations from the light source, but other components may be added and other configurations may be used, and these are also intended to be covered by this disclosure.
Although particular examples of detection systems have been described, combinations of these systems or other systems may also be used, and these are also within the scope of this disclosure. As one example, environmental fluctuations (such as turbulence or winds) may lead to fluctuations in the beam for active remote sensing or hyper-spectral imaging. A configuration such as FIG. 18A may be able to remove the effect of environmental fluctuations. Yet another technique may be to "wobble" the light beam after the light source using a vibrating mirror. The motion may lead to the beam moving enough to wash out spatial fluctuations within the beam waist at the sample or detection system. If the vibrating mirror is scanned faster than the integration time of the detectors, then the spatial fluctuations in the beam may be integrated out. Alternately, some sort of synchronous detection system may be used, where the detection is synchronized to the vibrating frequency.
In addition to the problem of other blood constituents or analytes having overlapping spectral features, it may be difficult to observe glucose spectral signatures through the skin and its constituents of water, adipose, collagen and elastin. One approach to overcoming this difficulty may be to try to measure the blood constituents in veins that are located at relatively shallow distances below the skin. Veins may be more beneficial for the measurement than arteries, since arteries tend to be located at deeper levels below the skin. Also, in one embodiment it may be advantageous to use a differential measurement to subtract out some of the interfering absorption lines from the skin. For example, an instrument head may be designed to place one probe above a region of skin over a blood vein, while a second probe may be placed at a region of the skin without a noticeable blood vein below it. Then, by differencing the signals from the two probes, at least part of the skin interference may be cancelled out.
Two representative embodiments for performing such a differential measurement are illustrated in FIG. 18B and FIG. 18C. In one embodiment shown in FIG. 18B, the dorsal of the hand 1820 may be used for measuring blood constituents or analytes. The dorsal of the hand 1820 may have regions that have distinct veins 1821 as well as regions where the veins are not as shallow or pronounced 1822. By stretching the hand and leaning it backwards, the veins 1821 may be accentuated in some cases. A near-infrared diffuse reflectance measurement may be performed by placing one probe 1823 above the vein-rich region 1821. To turn this into a differential measurement, a second probe 1824 may be placed above a region without distinct veins 1822. Then, the outputs from the two probes may be subtracted 1825 to at least partially cancel out the features from the skin. The subtraction may be done preferably in the electrical domain, although it can also be performed in the optical domain or digitally/mathematically using sampled data based on the electrical and/or optical signals. Although one example of using the dorsal of the hand 1820 is shown, many other parts of the hand can be used within the scope of this disclosure. For example, alternate methods may use transmission through the webbing between the thumb and the fingers 1826, or transmission or diffuse reflection through the tips of the fingers 1827.
In another embodiment, the dorsal of the foot 1830 may be used instead of the hand. One advantage of such a configuration may be that for self-testing by a user, the foot may be easier to position the instrument using both hands. One probe 1833 may be placed over regions where there are more distinct veins 1831, and a near-infrared diffuse reflectance measurement may be made. For a differential measurement, a second probe 1834 may be placed over a region with less prominent veins 1832, and then the two probe signals may be subtracted, either electronically or optically, or may be digitized/sampled and processed mathematically depending on the particular application and implementation. As with the hand, the differential measurements may be intended to compensate for or subtract out (at least in part) the interference from the skin. Since two regions are used in close proximity on the same body part, this may also aid in removing some variability in the skin from environmental effects such as temperature, humidity, or pressure. In addition, it may be advantageous to first treat the skin before the measurement, by perhaps wiping with a cloth or treated cotton ball, applying some sort of cream, or placing an ice cube or chilled bag over the region of interest.
Although two embodiments have been described, many other locations on the body may be used using a single or differential probe within the scope of this disclosure. In yet another embodiment, the wrist may be advantageously used, particularly where a pulse rate is typically monitored. Since the pulse may be easily felt on the wrist, there is underlying the region a distinct blood flow. Other embodiments may use other parts of the body, such as the ear lobes, the tongue, the inner lip, the nails, the eye, or the teeth. Some of these embodiments will be further described below. The ear lobes or the tip of the tongue may be advantageous because they are thinner skin regions, thus permitting transmission rather than diffuse reflection. However, the interference from the skin is still a problem in these embodiments. Other regions such as the inner lip or the bottom of the tongue may be contemplated because distinct veins are observable, but still the interference from the skin may be problematic in these embodiments. The eye may seem as a viable alternative because it is more transparent than skin. However, there are still issues with scattering in the eye. For example, the anterior chamber of the eye (the space between the cornea and the iris) comprises a fluid known as aqueous humor. However, the glucose level in the eye chamber may have a significant temporal lag on changes in the glucose level compared to the blood glucose level.
Light Sources for SWIR and Near Infrared
There are a number of light sources that may be used in the near infrared. To be more specific, the discussion below will consider light sources operating in the short wave infrared (SWIR), which may cover the wavelength range of approximately 1400 nm to 2500 nm. Other wavelength ranges may also be used for the applications described in this disclosure, so the discussion below is merely provided for exemplary types of light sources. The SWIR wavelength range may be valuable for a number of reasons. The SWIR corresponds to a transmission window through water and the atmosphere. Also, the so-called "eye-safe" wavelengths are wavelengths longer than approximately 1400 nm as previously described.
Different light sources may be selected for the SWIR based on the needs of the application. Some of the features for selecting a particular light source include power or intensity, wavelength range or bandwidth, spatial or temporal coherence, spatial beam quality for focusing or transmission over long distance, and pulse width or pulse repetition rate. Depending on the application, lamps, light emitting diodes (LEDs), laser diodes (LD's), tunable LD's, super-luminescent laser diodes (SLDs), fiber lasers or super-continuum sources (SC) may be advantageously used. Also, different fibers may be used for transporting the light, such as fused silica fibers, plastic fibers, mid-infrared fibers (e.g., tellurite, chalcogenides, fluorides, ZBLAN, etc), or a hybrid of these fibers.
Lamps may be used if low power or intensity of light is required in the SWIR, and if an incoherent beam is suitable. In one embodiment, in the SWIR an incandescent lamp that can be used is based on tungsten and halogen, which have an emission wavelength between approximately 500 nm to 2500 nm. For low intensity applications, it may also be possible to use thermal sources, where the SWIR radiation is based on the black body radiation from the hot object. Although the thermal and lamp based sources are broadband and have low intensity fluctuations, it may be difficult to achieve a high signal-to-noise ratio due to the low power levels. Also, the lamp based sources tend to be energy inefficient.
In another embodiment, LED's can be used that have a higher power level in the SWIR wavelength range. LED's also produce an incoherent beam, but the power level can be higher than a lamp and with higher energy efficiency. Also, the LED output may more easily be modulated, and the LED provides the option of continuous wave or pulsed mode of operation. LED's are solid state components that emit a wavelength band that is of moderate width, typically between about 20 nm to 40 nm. There are also so-called super-luminescent LEDs that may even emit over a much wider wavelength range. In another embodiment, a wide band light source may be constructed by combining different LEDs that emit in different wavelength bands, some of which could preferably overlap in spectrum. One advantage of LEDs as well as other solid state components is the compact size that they may be packaged into.
In yet another embodiment, various types of laser diodes may be used in the SWIR wavelength range. Just as LEDs may be higher in power but narrower in wavelength emission than lamps and thermal sources, the LDs may be yet higher in power but yet narrower in wavelength emission than LEDs. Different kinds of LDs may be used, including Fabry-Perot LDs, distributed feedback (DFB(LDs, distributed Bragg reflector (DBR) LDs. Since the LDs have relatively narrow wavelength range (typically under 10 nm), in one embodiment a plurality of LDs may be used that are at different wavelengths in the SWIR. The various LDs may be spatially multiplexed, polarization multiplexed, wavelength multiplexed, or a combination of these multiplexing methods. Also, the LDs may be fiber pig-tailed or have one or more lenses on the output to collimate or focus the light. Another advantage of LDs is that they may be packaged compactly and may have a spatially coherent beam output. Moreover, tunable LDs that can tune over a range of wavelengths are also available. The tuning may be done by varying the temperature, or electrical current may be used in particular structures such as distributed Bragg reflector LDs. In another embodiment, external cavity LDs may be used that have a tuning element, such as a fiber grating or a bulk grating, in the external cavity.
In another embodiment, super-luminescent laser diodes may provide higher power as well as broad bandwidth. An SLD is typically an edge emitting semiconductor light source based on super-luminescence (e.g., this could be amplified spontaneous emission). SLDs combine the higher power and brightness of LDs with the low coherence of conventional LEDs, and the emission band for SLD's may be 5 nm to 100 nm wide, preferably in the 60 nm to 100 nm range. Although currently SLDs are commercially available in the wavelength range of approximately 400 nm to 1700 nm, SLDs could and may in the future be made that cover a broader region of the SWIR.
In yet another embodiment, high power LDs for either direct excitation or to pump fiber lasers and SC light sources may be constructed using one or more laser diode bar stacks. FIG. 19 shows an example block diagram 1900 with building blocks for constructing the high power LDs. In this embodiment, one or more diode bar stacks 1901 may be used, where the diode bar stack may be an array of several single emitter LDs. Since the fast axis (e.g., vertical direction) may be nearly diffraction limited while the slow-axis (e.g., horizontal axis) may be far from diffraction limited, different collimators 1902 may be used for the two axes.
The brightness may be increased by spatially combining the beams from multiple stacks 1903. The combiner may include spatial interleaving, wavelength multiplexing, or a combination of the two. Different spatial interleaving schemes may be used, such as using an array of prisms or mirrors with spacers to bend one array of beams into the beam path of the other. In another embodiment, segmented mirrors with alternate high-reflection and anti-reflection coatings may be used. Moreover, the brightness may be increased by polarization beam combining 1904 the two orthogonal polarizations, such as by using a polarization beam splitter. In a particular embodiment, the output may then be focused or coupled into a large diameter core fiber. As an example, typical dimensions for the large diameter core fiber range from diameters of approximately 100 microns to 400 microns or more. Alternatively or in addition, a custom beam shaping module 1905 may be used, depending on the particular application. For example, the output of the high power LD may be used directly 1906, or it may be fiber coupled 1907 to combine, integrate, or transport the high power LD energy. These high power LDs may grow in importance because the LD powers can rapidly scale up. For example, instead of the power being limited by the power available from a single emitter, the power may increase in multiples depending on the number of diodes multiplexed and the size of the large diameter fiber. Although FIG. 19 is shown as one embodiment, some or all of the elements may be used in a high power LD, or additional elements may also be used.
SWIR Super-Continuum Lasers
Each of the light sources described above have particular strengths, but they also may have limitations. For example, there is typically a trade-off between wavelength range and power output. Also, sources such as lamps, thermal sources, and LEDs produce incoherent beams that may be difficult to focus to a small area and may have difficulty propagating for long distances. An alternative source that may overcome some of these limitations is an SC light source. Some of the advantages of the SC source may include high power and intensity, wide bandwidth, spatially coherent beam that can propagate nearly transform limited over long distances, and easy compatibility with fiber delivery.
Supercontinuum lasers may combine the broadband attributes of lamps with the spatial coherence and high brightness of lasers. By exploiting a modulational instability initiated supercontinuum (SC) mechanism, an all-fiber-integrated SC laser with no moving parts may be built using commercial-off-the-shelf (COTS) components. Moreover, the fiber laser architecture may be a platform where SC in the visible, near-infrared/SWIR, or mid-IR can be generated by appropriate selection of the amplifier technology and the SC generation fiber. But until recently, SC lasers were used primarily in laboratory settings since typically large, table-top, mode-locked lasers were used to pump nonlinear media such as optical fibers to generate SC light. However, those large pump lasers may now be replaced with diode lasers and fiber amplifiers that gained maturity in the telecommunications industry.
In one embodiment, an all-fiber-integrated, high-powered SC light source 2000 may be elegant for its simplicity (FIG. 20). The light may be first generated from a seed laser diode 2001. For example, the seed LD 2001 may be a distributed feedback (DFB) laser diode with a wavelength near 1542 nm or 1550 nm, with approximately 0.5-2.0 ns pulsed output, and with a pulse repetition rate between one kilohertz to about 100 MHz or more. The output from the seed laser diode may then be amplified in a multiple-stage fiber amplifier 2002 comprising one or more gain fiber segments. In a particular embodiment, the first stage pre-amplifier 2003 may be designed for optimal noise performance. For example, the pre-amplifier 2003 may be a standard erbium-doped fiber amplifier or an erbium/ytterbium doped cladding pumped fiber amplifier. Between amplifier stages 2003 and 2006, it may be advantageous to use band-pass filters 2004 to block amplified spontaneous emission and isolators 2005 to prevent spurious reflections. Then, the power amplifier stage 2006 may use a cladding-pumped fiber amplifier that may be optimized to minimize nonlinear distortion. The power amplifier fiber 2006 may also be an erbium-doped fiber amplifier, if only low or moderate power levels are to be generated.
The SC generation 2007 may occur in the relatively short lengths of fiber that follow the pump laser. Exemplary SC fiber lengths may range from a few millimeters to 100 m or more. In one embodiment, the SC generation may occur in a first fiber 2008 where the modulational-instability initiated pulse break-up occurs primarily, followed by a second fiber 2009 where the SC generation and spectral broadening occurs primarily.
In one embodiment, one or two meters of standard single-mode fiber (SMF) after the power amplifier stage may be followed by several meters of SC generation fiber. For this example, in the SMF the peak power may be several kilowatts and the pump light may fall in the anomalous group-velocity dispersion regime--often called the soliton regime. For high peak powers in the anomalous dispersion regime, the nanosecond pulses may be unstable due to a phenomenon known as modulational instability, which is basically parametric amplification in which the fiber nonlinearity helps to phase match the pulses. As a consequence, the nanosecond pump pulses may be broken into many shorter pulses as the modulational instability tries to form soliton pulses from the quasi-continuous-wave background. Although the laser diode and amplification process starts with approximately nanosecond-long pulses, modulational instability in the short length of SMF fiber may form approximately 0.5 ps to several-picosecond-long pulses with high intensity. Thus, the few meters of SMF fiber may result in an output similar to that produced by mode-locked lasers, except in a much simpler and cost-effective manner.
The short pulses created through modulational instability may then be coupled into a nonlinear fiber for SC generation. The nonlinear mechanisms leading to broadband SC may include four-wave mixing or self-phase modulation along with the optical Raman effect. Since the Raman effect is self-phase-matched and shifts light to longer wavelengths by emission of optical photons, the SC may spread to longer wavelengths very efficiently. The short-wavelength edge may arise from four-wave mixing, and often times the short wavelength edge may be limited by increasing group-velocity dispersion in the fiber. In many instances, if the particular fiber used has sufficient peak power and SC fiber length, the SC generation process may fill the long-wavelength edge up to the transmission window.
Mature fiber amplifiers for the power amplifier stage 2006 include ytterbium-doped fibers (near 1060 nm), erbium-doped fibers (near 1550 nm), erbium/ytterbium-doped fibers (near 1550 nm), or thulium-doped fibers (near 2000 nm). In various embodiments, candidates for SC fiber 2009 include fused silica fibers (for generating SC between 0.8-2.7 .mu.m), mid-IR fibers such as fluorides, chalcogenides, or tellurites (for generating SC out to 4.5 .mu.m or longer), photonic crystal fibers (for generating SC between 0.4-1.7 m), or combinations of these fibers. Therefore, by selecting the appropriate fiber-amplifier doping for 2006 and nonlinear fiber 2009, SC may be generated in the visible, near-IR/SWIR, or mid-IR wavelength region.
The configuration 2000 of FIG. 20 is just one particular example, and other configurations can be used and are intended to be covered by this disclosure. For example, further gain stages may be used, and different types of lossy elements or fiber taps may be used between the amplifier stages. In another embodiment, the SC generation may occur partially in the amplifier fiber and in the pig-tails from the pump combiner or other elements. In yet another embodiment, polarization maintaining fibers may be used, and a polarizer may also be used to enhance the polarization contrast between amplifier stages. Also, not discussed in detail are many accessories that may accompany this set-up, such as driver electronics, pump laser diodes, safety shut-offs, and thermal management and packaging.
In one embodiment, one example of the SC laser that operates in the SWIR is illustrated in FIG. 21. This SWIR SC source 2100 produces an output of up to approximately 5 W over a spectral range of about 1.5-2.4 microns, and this particular laser is made out of polarization maintaining components. The seed laser 2101 is a distributed feedback (DFB) laser operating near 1542 nm producing approximately 0.5 nsec pulses at an about 8 MHz repetition rate. The pre-amplifier 2102 is forward pumped and uses about 2 m length of erbium/ytterbium cladding pumped fiber 2103 (often also called dual-core fiber) with an inner core diameter of 12 microns and outer core diameter of 130 microns. The pre-amplifier gain fiber 2103 is pumped using a 10 W laser diode near 940 nm 2105 that is coupled in using a fiber combiner 2104.
In this particular 5 W unit, the mid-stage between amplifier stages 2102 and 2106 comprises an isolator 2107, a band-pass filter 2108, a polarizer 2109 and a fiber tap 2110. The power amplifier 2106 uses an approximately 4 m length of the 12/130 micron erbium/ytterbium doped fiber 2111 that is counter-propagating pumped using one or more 30 W laser diodes near 940 nm 2112 coupled in through a combiner 2113. An approximately 1-2 m length of the combiner pig-tail helps to initiate the SC process, and then a length of PM-1550 fiber 2115 (polarization maintaining, single-mode, fused silica fiber optimized for 1550 nm) is spliced 2114 to the combiner output.
If an output fiber of about 10 m in length is used, then the resulting output spectrum 2200 is shown in FIG. 22. The details of the output spectrum 2200 depend on the peak power into the fiber, the fiber length, and properties of the fiber such as length and core size, as well as the zero dispersion wavelength and the dispersion properties. For example, if a shorter length of fiber is used, then the spectrum actually reaches to longer wavelengths (e.g., a 2 m length of SC fiber broadens the spectrum to about 2500 nm). Also, if extra-dry fibers are used with less O--H content, then the wavelength edge may also reach to a longer wavelength. To generate more spectrum toward the shorter wavelengths, the pump wavelength (in this case around 1542 nm) should be close to the zero dispersion wavelength in the fiber. For example, by using a dispersion shifted fiber or so-called non-zero dispersion shifted fiber, the short wavelength edge may shift to shorter wavelengths.
Although one particular example of a 5 W SWIR-SC has been described, different components, different fibers, and different configurations may also be used consistent with this disclosure. For instance, another embodiment of the similar configuration 2100 in FIG. 21 may be used to generate high powered SC between approximately 1060 nm and 1800 nm. For this embodiment, the seed laser 2101 may be a distributed feedback laser diode around 1064 nm, the pre-amplifier gain fiber 2103 may be a ytterbium-doped fiber amplifier with 10/125 microns dimensions, and the pump laser 2105 may be a 10 W laser diode near 915 nm. A mode field adapter may be included in the mid-stage, in addition to the isolator 2107, band pass filter 2108, polarizer 2109 and tap 2110. The gain fiber 2111 in the power amplifier may be an about 20 m length of ytterbium-doped fiber with 25/400 microns dimension. The pump 2112 for the power amplifier may be up to six pump diodes providing 30 W each near 915 nm. For this much pump power, the output power in the SC may be as high as 50 W or more.
In one embodiment, it may be desirous to generate high power SWIR SC over 1.4-1.8 microns and separately 2-2.5 microns (the window between 1.8 and 2 microns may be less important due to the strong water and atmospheric absorption). For example, the SC source of FIG. 23A can lead to bandwidths ranging from about 1400 nm to 1800 nm or broader, while the SC source of FIG. 23B can lead to bandwidths ranging from about 1900 nm to 2500 nm or broader. Since these wavelength ranges are shorter than about 2500 nm, the SC fiber can be based on fused silica fiber. Exemplary SC fibers include standard single-mode fiber SMF, high-nonlinearity fiber, high-NA fiber, dispersion shifted fiber, dispersion compensating fiber, and photonic crystal fibers. Non-fused-silica fibers can also be used for SC generation, including chalcogenides, fluorides, ZBLAN, tellurites, and germanium oxide fibers.
In one embodiment, FIG. 23A illustrates an exemplary block diagram for an SC source 2300 capable of generating light between approximately 1400 nm and 1800 nm or broader. As an example, a pump fiber laser similar to FIG. 21 can be used as the input to a SC fiber 2309. The seed laser diode 2301 can comprise a DFB laser that generates, for example, several milliwatts of power around 1542 nm or 1553 nm. The fiber pre-amplifier 2302 can comprise an erbium-doped fiber amplifier or an erbium/ytterbium doped double clad fiber. In this example a mid-stage amplifier 2303 can be used, which can comprise an erbium/ytterbium doped double-clad fiber. A bandpass filter 2305 and isolator 2306 may be used between the pre-amplifier 2302 and mid-stage amplifier 2303. The power amplifier stage 2304 can comprise a larger core size erbium/ytterbium doped double-clad fiber, and another bandpass filter 2307 and isolator 2308 can be used before the power amplifier 2304. The output of the power amplifier can be coupled to the SC fiber 2309 to generate the SC output 2310. This is just one exemplary configuration for an SC source, and other configurations or elements may be used consistent with this disclosure.
In yet another embodiment, FIG. 23B illustrates a block diagram for an exemplary SC source 2350 capable of generating light between approximately 1900 nm and 2500 nm or broader. As an example, the seed laser diode 2351 can comprise a DFB or DBR laser that generates, for example, several milliwatts of power around 1542 nm or 1553 nm. The fiber pre-amplifier 2352 can comprise an erbium-doped fiber amplifier or an erbium/ytterbium doped double-clad fiber. In this example a mid-stage amplifier 2353 can be used, which can comprise an erbium/ytterbium doped double-clad fiber. A bandpass filter 2355 and isolator 2356 may be used between the pre-amplifier 2352 and mid-stage amplifier 2353. The power amplifier stage 2354 can comprise a thulium doped double-clad fiber, and another isolator 2357 can be used before the power amplifier 2354. Note that the output of the mid-stage amplifier 2353 can be approximately near 1542 nm, while the thulium-doped fiber amplifier 2354 can amplify wavelengths longer than approximately 1900 nm and out to about 2100 nm. Therefore, for this configuration wavelength shifting may be required between 2353 and 2354. In one embodiment, the wavelength shifting can be accomplished using a length of standard single-mode fiber 2358, which can have a length between approximately 5 m and 50 m, for example. The output of the power amplifier 2354 can be coupled to the SC fiber 2359 to generate the SC output 2360. This is just one exemplary configuration for an SC source, and other configurations or elements can be used consistent with this disclosure. For example, the various amplifier stages can comprise different amplifier types, such as erbium doped fibers, ytterbium doped fibers, erbium/ytterbium co-doped fibers and thulium doped fibers. One advantage of the SC lasers illustrated in FIGS. 20, 21, and 23A-B are that they may use all-fiber components, so that the SC laser can be all-fiber, monolithically integrated with no moving parts. The all-integrated configuration can consequently be robust and reliable.
FIGS. 20, 21 and 23A-B are examples of SC light sources that may advantageously be used for near-infrared or SWIR light generation in various spectroscopy, active remote sensing and hyper-spectral imaging applications. However, many other versions of the SC light sources may also be made that are intended to also be covered by this disclosure. For example, the SC generation fiber could be pumped by a mode-locked laser, a gain-switched semiconductor laser, an optically pumped semiconductor laser, a solid state laser, other fiber lasers, or a combination of these types of lasers. Also, rather than using a fiber for SC generation, either a liquid or a gas cell might be used as the nonlinear medium in which the spectrum is to be broadened.
Even within the all-fiber versions illustrated such as in FIG. 21, different configurations could be used consistent with the disclosure. In one embodiment, it may be desirous to have a lower cost version of the SWIR SC laser of FIG. 21. One way to lower the cost could be to use a single stage of optical amplification, rather than two stages, which may be feasible if lower output power is required or the gain fiber is optimized. For example, the pre-amplifier stage 2102 might be removed, along with at least some of the mid-stage elements. In yet another embodiment, the gain fiber could be double passed to emulate a two stage amplifier. In this example, the pre-amplifier stage 2102 might be removed, and perhaps also some of the mid-stage elements. A mirror or fiber grating reflector could be placed after the power amplifier stage 2106 that may preferentially reflect light near the wavelength of the seed laser 2101. If the mirror or fiber grating reflector can transmit the pump light near 940 nm, then this could also be used instead of the pump combiner 2113 to bring in the pump light 2112. The SC fiber 2115 could be placed between the seed laser 2101 and the power amplifier stage 2106 (SC is only generated after the second pass through the amplifier, since the power level may be sufficiently high at that time). In addition, an output coupler may be placed between the seed laser diode 2101 and the SC fiber, which now may be in front of the power amplifier 2106. In a particular embodiment, the output coupler could be a power coupler or divider, a dichroic coupler (e.g., passing seed laser wavelength but outputting the SC wavelengths), or a wavelength division multiplexer coupler. This is just one further example, but a myriad of other combinations of components and architectures could also be used for SC light sources to generate near-infrared or SWIR light that are intended to be covered by this disclosure.
FIG. 23C illustrates a reflection-spectroscopy based stand-off detection system having an SC laser source. The set-up 2370 for the reflection-spectroscopy-based stand-off detection system includes an SC source 2371. First, the diverging SC output is collimated to a 1 cm diameter beam using a 25 mm focal length, 90 degrees off-axis, gold coated, parabolic mirror 2372. To reduce the effects of chromatic aberration, refractive optics are avoided in the setup. All focusing and collimation is done using metallic mirrors that have almost constant reflectivity and focal length over the entire SC output spectrum. The sample 2374 is kept at a distance from the collimating mirror 2372, which provides a total round trip path length of twice the distance before reaching the collection optics 2375. A 12 cm diameter silver coated concave mirror 2375 with a 75 cm focal length is kept 20 cm to the side of the collimation mirror 2372. The mirror 2375 is used to collect a fraction of the diffusely reflected light from the sample, and focus it into the input slit of a monochromator 2376. Thus, the beam is incident normally on the sample 2374, but detected at a reflection angle of tan-1(0.2/5) or about 2.3 degrees. Appropriate long wavelength pass filters mounted in a motorized rotating filter wheel are placed in the beam path before the input slit 2376 to avoid contribution from higher wavelength orders from the grating (300 grooves/mm, 2 .mu.m blaze). The output slit width is set to 2 mm corresponding to a spectral resolution of 10.8 nm, and the light is detected by a 2 mm.times.2 mm liquid nitrogen cooled (77 K) indium antimonide (InSb) detector 2377. The detected output is amplified using a trans-impedance pre-amplifier 2377 with a gain of about 105 V/A and connected to a lock-in amplifier 2378 setup for high sensitivity detection. The chopper frequency is 400 Hz, and the lock-in time constant is set to 100 ms corresponding to a noise bandwidth of about 1 Hz. These are exemplary elements and parameter values, but other or different optical elements may be used consistent with this disclosure.
By use of an active illuminator, a number of advantages may be achieved, such as higher signal-to-noise ratios. For example, one way to improve the signal-to-noise ratio would be to use modulation and lock-in techniques. In one embodiment, the light source may be modulated, and then the detection system would be synchronized with the light source. In a particular embodiment, the techniques from lock-in detection may be used, where narrow band filtering around the modulation frequency may be used to reject noise outside the modulation frequency. In an alternate embodiment, change detection schemes may be used, where the detection system captures the signal with the light source on and with the light source off. Again, for this system the light source may be modulated. Then, the signal with and without the light source is differenced. This may enable the sun light changes to be subtracted out. In addition, change detection may help to identify objects that change in the field of view. A higher light level or intensity may improve the signal-to-noise ratio for the measurement. Second, mathematical modeling and signal processing methodologies may help to reduce the interference, such as multivariate techniques, multiple linear regression, and factor-based algorithms, for example. For instance, a number of mathematical approaches include multiple linear regression, partial least squares, and principal component regression (PCR).
Described herein are just some examples of the beneficial use of near-infrared or SWIR lasers for spectroscopy, active remote sensing or hyper-spectral imaging. However, many other spectroscopy and identification procedures can use the near-infrared or SWIR light consistent with this disclosure and are intended to be covered by the disclosure. As one example, the fiber-based super-continuum lasers may have a pulsed output with pulse durations of approximately 0.5-2 nsec and pulse repetition rates of several Megahertz. Therefore, the near-infrared or SWIR spectroscopy, active remote sensing or hyper-spectral imaging applications may also be combined with LIDAR-type applications. Namely, the distance or time axis can be added to the information based on time-of-flight measurements. For this type of information to be used, the detection system would also have to be time-gated to be able to measure the time difference between the pulses sent and the pulses received. By calculating the round-trip time for the signal, the distance of the object may be judged. In another embodiment, GPS (global positioning system) information may be added, so the near-infrared or SWIR spectroscopy, active remote sensing or hyper-spectral imagery would also have a location tag on the data. Moreover, the near-infrared or SWIR spectroscopy, active remote sensing or hyper-spectral imaging information could also be combined with two-dimensional or three-dimensional images to provide a physical picture as well as a chemical composition identification of the materials. These are just some modifications of the near-infrared or SWIR spectroscopy, active remote sensing or hyper-spectral imaging system described in this disclosure, but other techniques may also be added or combinations of these techniques may be added, and these are also intended to be covered by this disclosure.
Wireless Link to the Cloud
The non-invasive blood constituent or analytes measurement device may also benefit from communicating the data output to the "cloud" (e.g., data servers and processors in the web remotely connected) via wired and/or wireless communication strategies. The non-invasive devices may be part of a series of biosensors applied to the patient, and collectively these devices form what might be called a body area network or a personal area network. The biosensors and non-invasive devices may communicate to a smart phone, tablet, personal data assistant, computer, and/or other microprocessor-based device, which may in turn wirelessly or over wire and/or fiber optically transmit some or all of the signal or processed data to the internet or cloud. The cloud or internet may in turn send the data to doctors or health care providers as well as the patients themselves. Thus, it may be possible to have a panoramic, high-definition, relatively comprehensive view of a patient that doctors can use to assess and manage disease, and that patients can use to help maintain their health and direct their own care.
In a particular embodiment 2400 illustrated in FIG. 24, the physiological measurement device or non-invasive blood constituent measurement device 2401 may comprise a transmitter 2403 to communicate over a first communication link 2404 in the body area network or personal area network to a receiver in a smart phone, tablet cell phone, PDA, or computer 2405. For the measurement device 2401, it may also be advantageous to have a processor 2402 to process some of the physiological data, since with processing the amount of data to transmit may be less (hence, more energy efficient). The first communication link 2404 may operate through the use of one of many wireless technologies such as Bluetooth, Zigbee, WiFi, IrDA (infrared data association), wireless USB, or Z-wave, to name a few. Alternatively, the communication link 2404 may occur in the wireless medical band between 2360 and 2390 MHz, which the FCC allocated for medical body area network devices, or in other designated medical device or WMTS bands. These are examples of devices that can be used in the body area network and surroundings, but other devices could also be used and are included in the scope of this disclosure.
The personal device 2405 may store, process, display, and transmit some of the data from the measurement device 2401. The device 2405 may comprise a receiver, transmitter, display, voice control and speakers, and one or more control buttons or knobs and a touch screen. Examples of the device 2405 include smart phones such as the Apple iPhones.RTM. or phones operating on the Android or Microsoft systems. In one embodiment, the device 2405 may have an application, software program, or firmware to receive and process the data from the measurement device 2401. The device 2405 may then transmit some or all of the data or the processed data over a second communication link 2406 to the internet or "cloud" 2407. The second communication link 2406 may advantageously comprise at least one segment of a wireless transmission link, which may operate using WiFi or the cellular network. The second communication link 2406 may additionally comprise lengths of fiber optic and/or communication over copper wires or cables.
The internet or cloud 2407 may add value to the measurement device 2401 by providing services that augment the physiological data collected. In a particular embodiment, some of the functions performed by the cloud include: (a) receive at least a fraction of the data from the device 2405; (b) buffer or store the data received; (c) process the data using software stored on the cloud; (d) store the resulting processed data; and (e) transmit some or all of the data either upon request or based on an alarm. As an example, the data or processed data may be transmitted 2408 back to the originator (e.g., patient or user), it may be transmitted 2409 to a health care provider or doctor, or it may be transmitted 2410 to other designated recipients.
The cloud 2407 may provide a number of value-add services. For example, the cloud application may store and process the physiological data for future reference or during a visit with the healthcare provider. If a patient has some sort of medical mishap or emergency, the physician can obtain the history of the physiological parameters over a specified period of time. In another embodiment, if the physiological parameters fall out of acceptable range, alarms may be delivered to the user 2408, the healthcare provider 2409, or other designated recipients 2410. These are just some of the features that may be offered, but many others may be possible and are intended to be covered by this disclosure. As an example, the device 2405 may also have a GPS sensor, so the cloud 2407 may be able to provide time, data and position along with the physiological parameters. Thus, if there is a medical emergency, the cloud 2407 could provide the location of the patient to the healthcare provider 2409 or other designated recipients 2410. Moreover, the digitized data in the cloud 2407 may help to move toward what is often called "personalized medicine." Based on the physiological parameter data history, medication or medical therapies may be prescribed that are customized to the particular patient.
Beyond the above benefits, the cloud application 2407 and application on the device 2405 may also have financial value for companies developing measurement devices 2401 such as a non-invasive blood constituent monitor. In the case of glucose monitors, the companies make the majority of their revenue on the measurement strips. However, with a non-invasive monitor, there is no need for strips, so there is less of an opportunity for recurring costs (e.g., the razor/razor blade model does not work for non-invasive devices). On the other hand, people may be willing to pay a periodic fee for the value-add services provided on the cloud 2407. Diabetic patients, for example, would probably be willing to pay a periodic fee for monitoring their glucose levels, storing the history of the glucose levels, and having alarm warnings when the glucose level falls out of range. Similarly, patients taking ketone bodies supplement for treatment of disorders characterized by impaired glucose metabolism (e.g., Alzheimer's, Parkinson's, Huntington's or ALS) may need to monitor their ketone bodies level. These patients would also probably be willing to pay a periodic fee for the value-add services provided on the cloud 2407. Thus, by leveraging the advances in wireless connectivity and the widespread use of handheld devices such as smart phones that can wirelessly connect to the cloud, businesses can build a recurring cost business model even using non-invasive measurement devices.
Described herein are just some examples of the beneficial use of near-infrared or SWIR lasers for non-invasive monitoring of glucose, ketones, HbA1c and other blood constituents. However, many other medical procedures can use the near-infrared or SWIR light consistent with this disclosure and are intended to be covered by the disclosure.
Although the present disclosure has been described in several embodiments, a myriad of changes, variations, alterations, transformations, and modifications may be suggested to one skilled in the art, and it is intended that the present disclosure encompass such changes, variations, alterations, transformations, and modifications as falling within the spirit and scope of the appended claims.
While exemplary embodiments are described above, it is not intended that these embodiments describe all possible forms of the disclosure. Rather, the words used in the specification are words of description rather than limitation, and it is understood that various changes may be made without departing from the spirit and scope of the disclosure. Additionally, the features of various implementing embodiments may be combined to form further embodiments of the disclosure. While various embodiments may have been described as providing advantages or being preferred over other embodiments with respect to one or more desired characteristics, as one skilled in the art is aware, one or more characteristics may be compromised to achieve desired system attributes, which depend on the specific application and implementation. These attributes include, but are not limited to: cost, strength, durability, life cycle cost, marketability, appearance, packaging, size, serviceability, weight, manufacturability, ease of assembly, etc. The embodiments described herein that are described as less desirable than other embodiments or prior art implementations with respect to one or more characteristics are not outside the scope of the disclosure and may be desirable for particular applications.
* * * * *
References
D00000
D00001
D00002
D00003
D00004
D00005
D00006
D00007
D00008
D00009
D00010
D00011
D00012

D00013

D00014

D00015

D00016

D00017

D00018

D00019

D00020

D00021

D00022
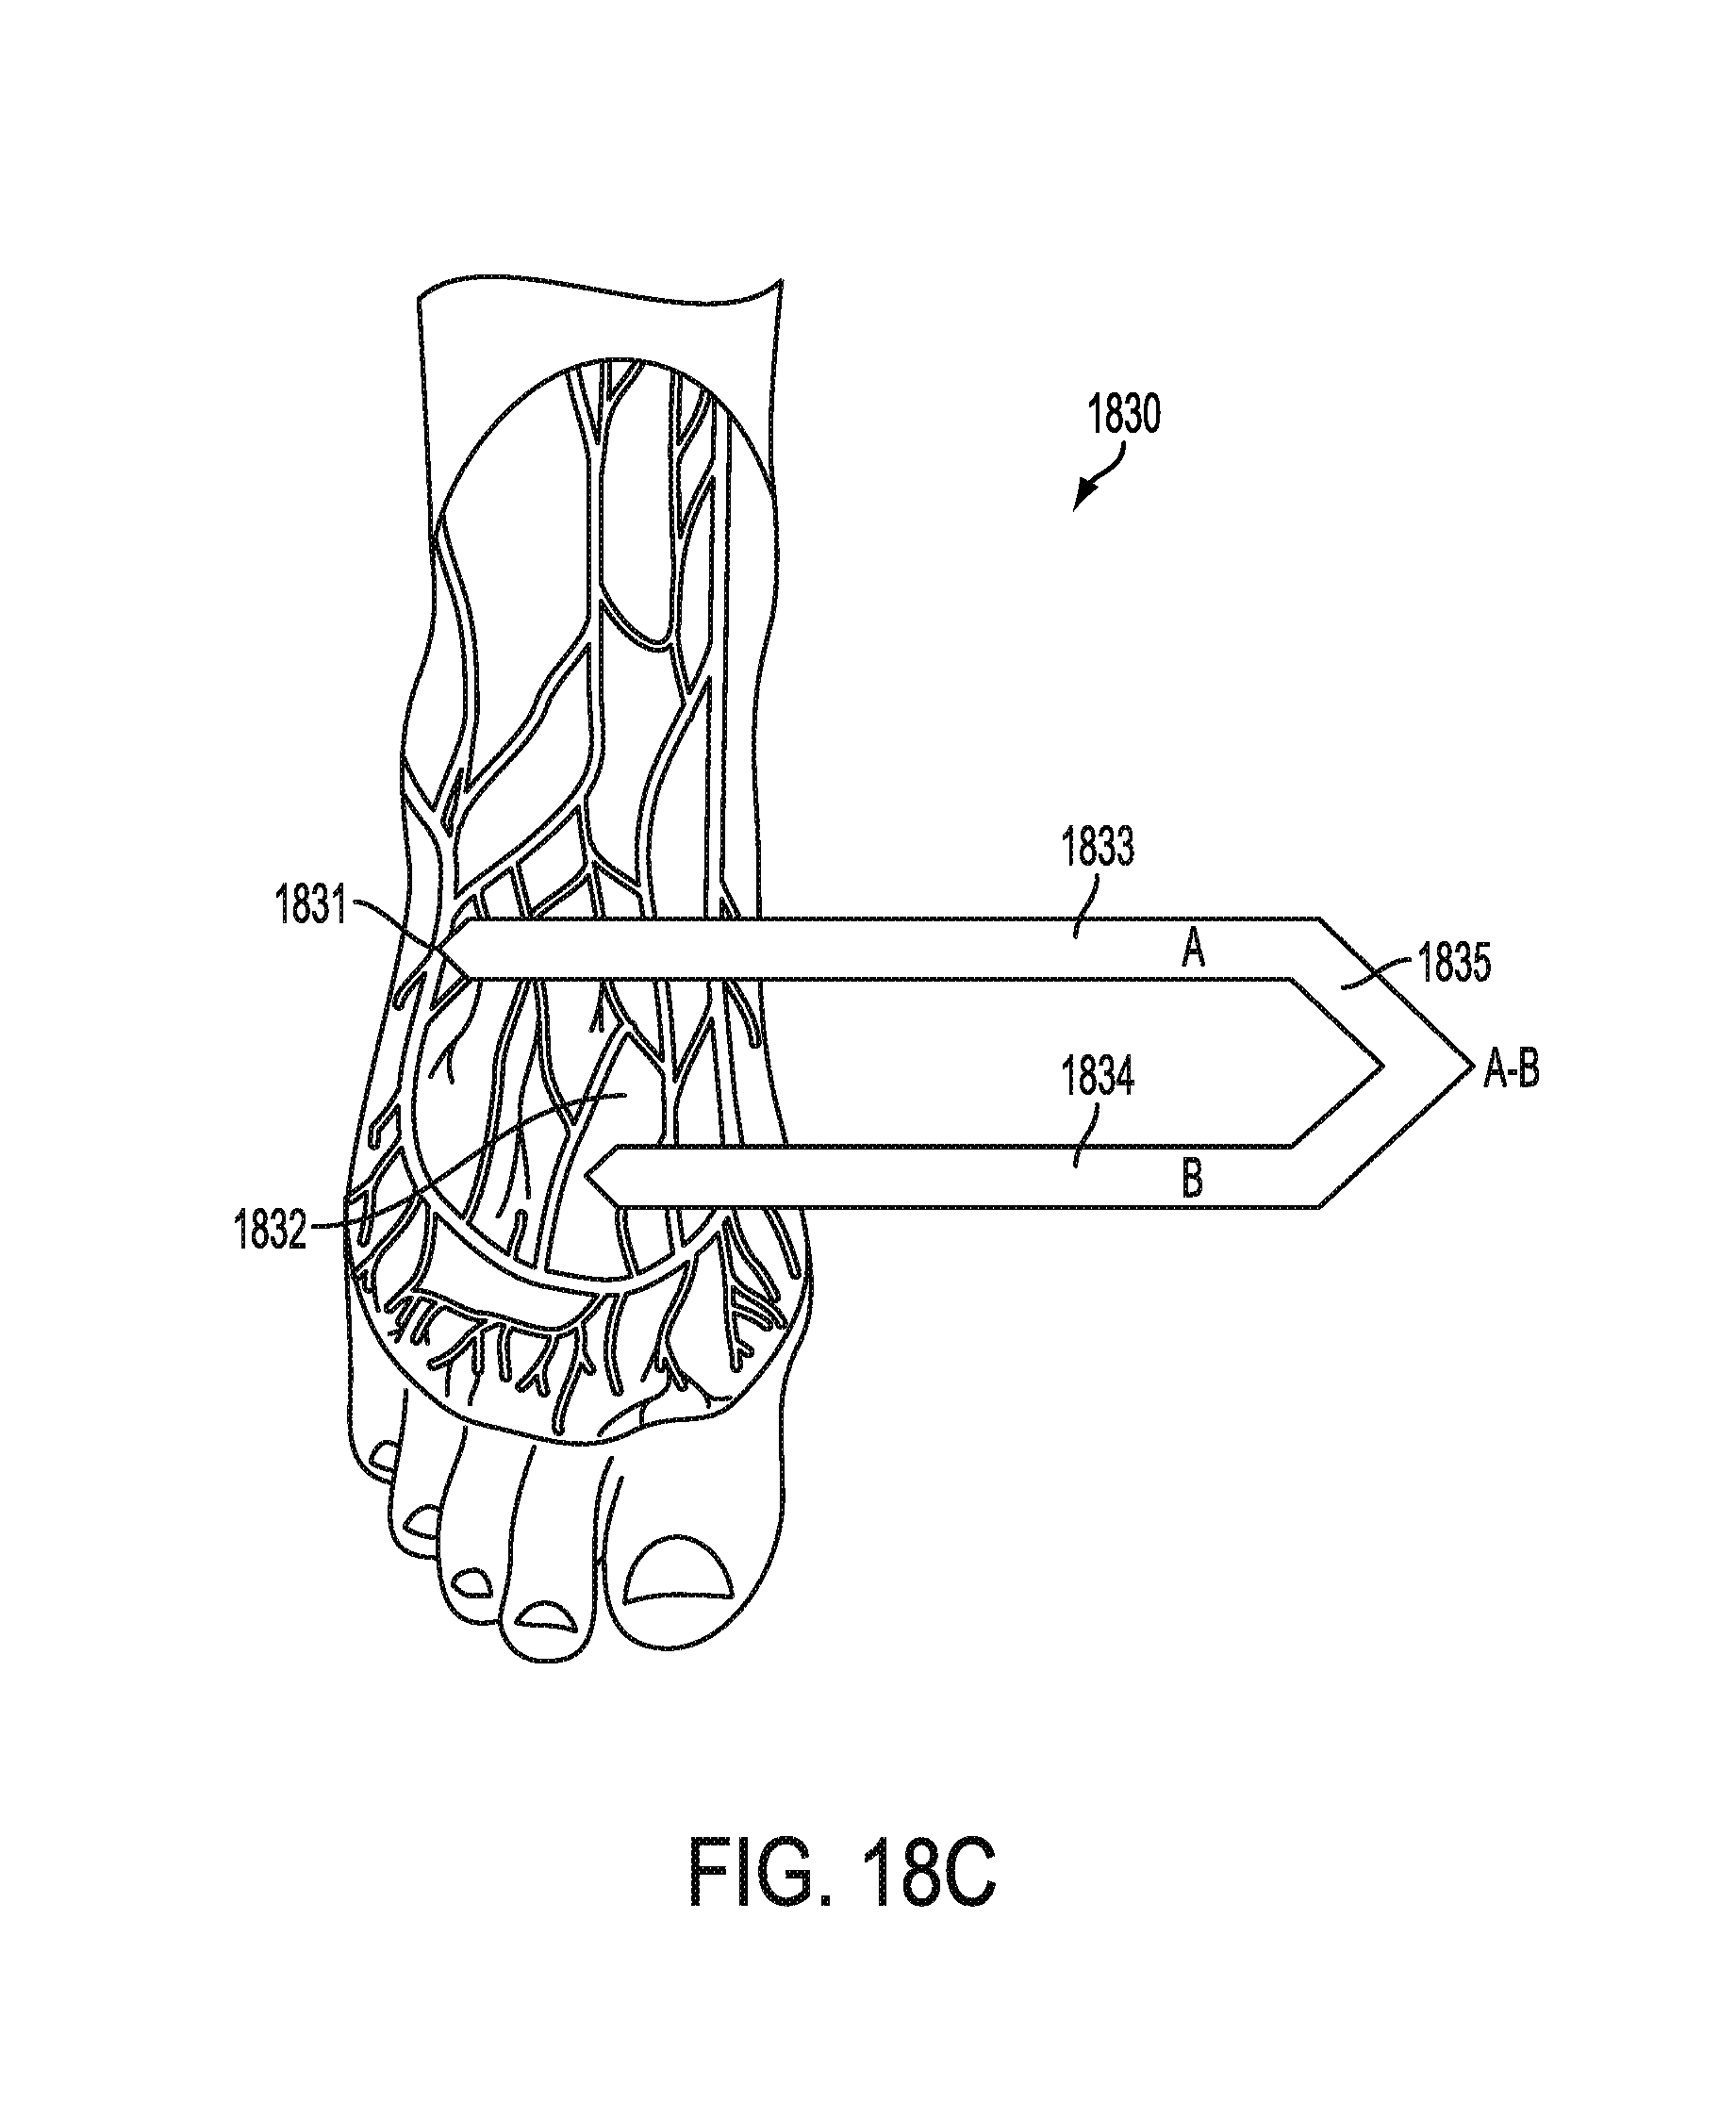
D00023

D00024

D00025

D00026

D00027

D00028

D00029

XML
uspto.report is an independent third-party trademark research tool that is not affiliated, endorsed, or sponsored by the United States Patent and Trademark Office (USPTO) or any other governmental organization. The information provided by uspto.report is based on publicly available data at the time of writing and is intended for informational purposes only.
While we strive to provide accurate and up-to-date information, we do not guarantee the accuracy, completeness, reliability, or suitability of the information displayed on this site. The use of this site is at your own risk. Any reliance you place on such information is therefore strictly at your own risk.
All official trademark data, including owner information, should be verified by visiting the official USPTO website at www.uspto.gov. This site is not intended to replace professional legal advice and should not be used as a substitute for consulting with a legal professional who is knowledgeable about trademark law.